29
/
en
AIzaSyAYiBZKx7MnpbEhh9jyipgxe19OcubqV5w
April 1, 2024
31599
Europe & Central Asia (excluding high income)
ECA
false
2
1
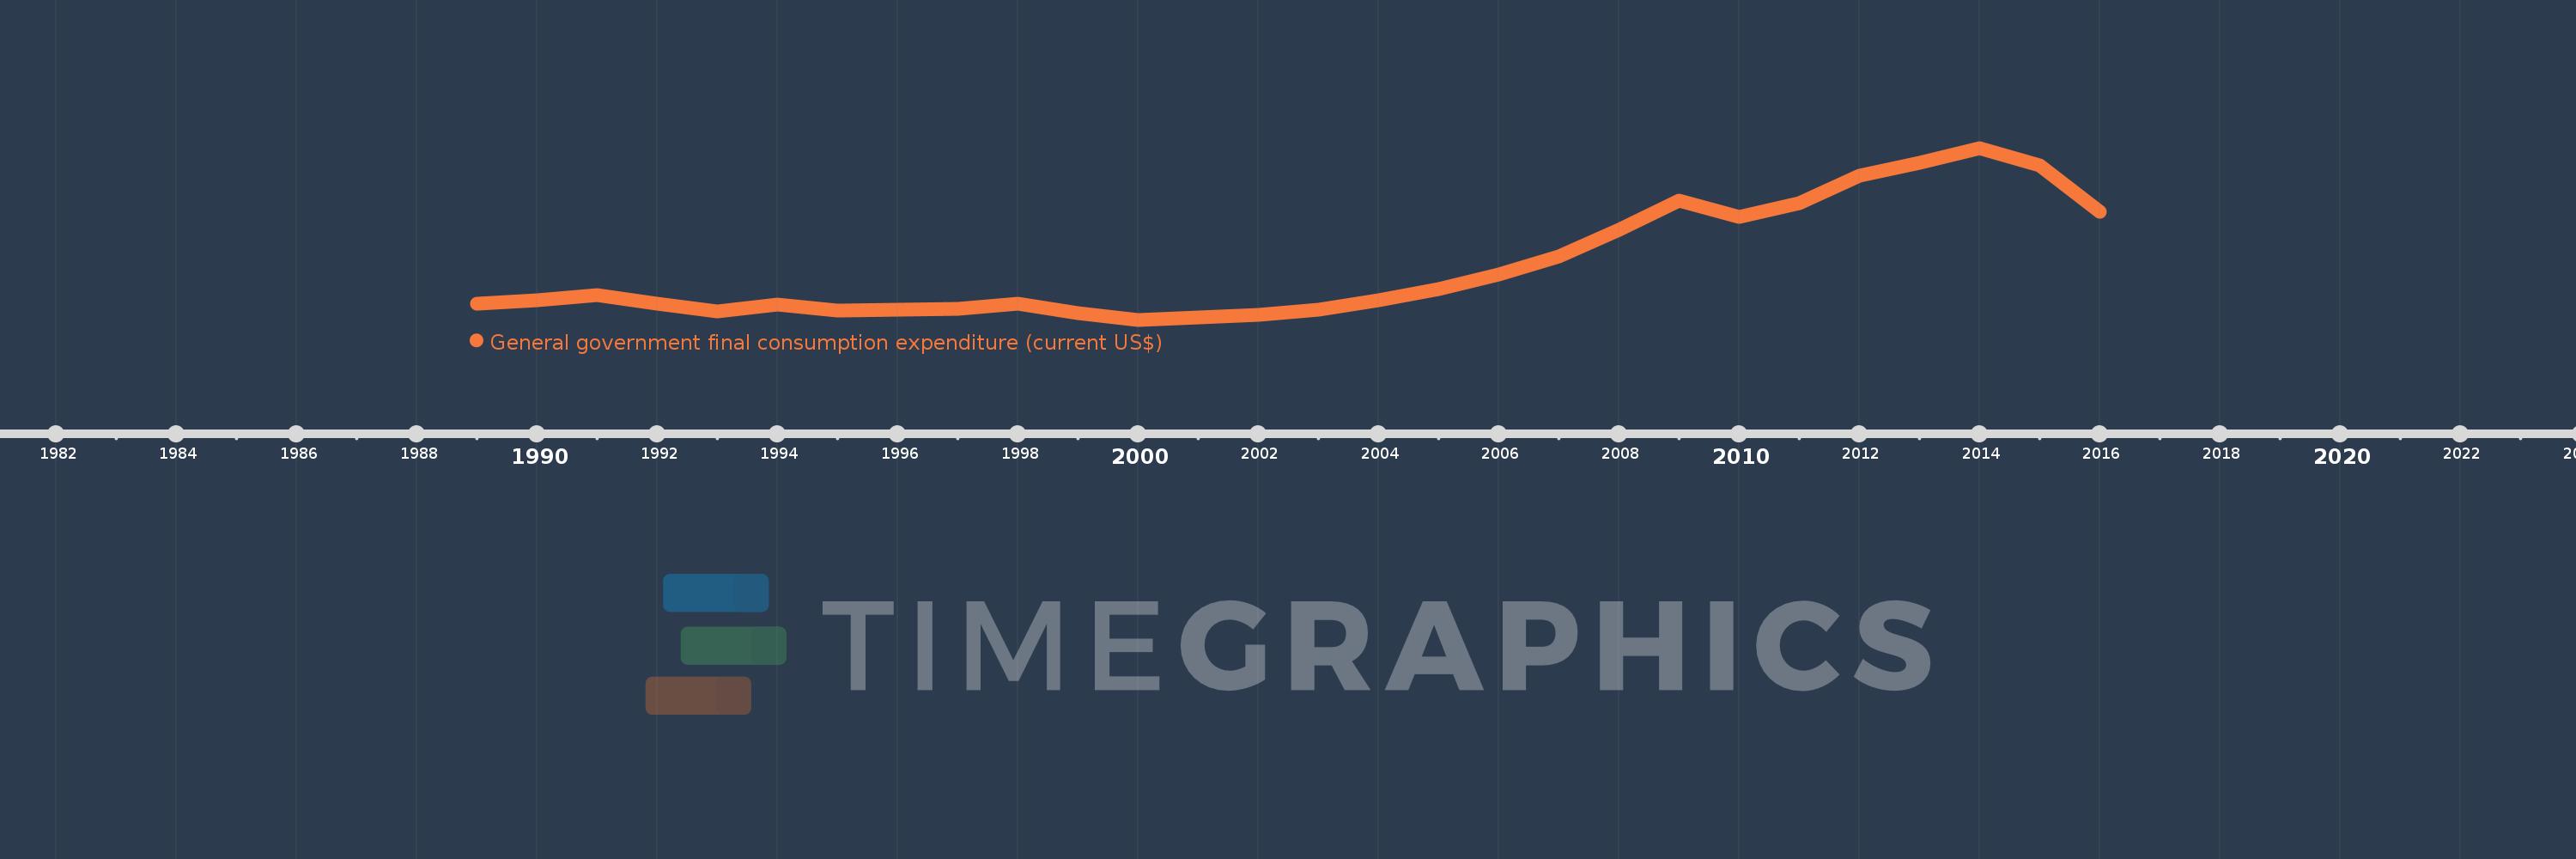
General government final consumption expenditure (current US$)
2016,2015,2014,2013,2012,2011,2010,2009,2008,2007,2006,2005,2004,2003,2002,2001,2000,1999,1998,1997,1996,1995,1994,1993,1992,1991,1990,1989
This statistics in other country:
AfghanistanAlbaniaAlgeriaAngolaAntigua and BarbudaArab WorldArgentinaArmeniaArubaAustraliaAustriaAzerbaijanBahamas, TheBahrainBangladeshBarbadosBelarusBelgiumBelizeBeninBermudaBhutanBoliviaBosnia and HerzegovinaBotswanaBrazilBrunei DarussalamBulgariaBurkina FasoBurundiCabo VerdeCambodiaCameroonCanadaCaribbean small statesCentral African RepublicCentral Europe and the BalticsChadChileChinaColombiaComorosCongo, Dem. Rep.Congo, Rep.Costa RicaCote d'IvoireCroatiaCubaCyprusCzech RepublicDenmarkDjiboutiDominicaDominican RepublicEarly-demographic dividendEast Asia & PacificEast Asia & Pacific (excluding high income)East Asia & Pacific (IDA & IBRD countries)EcuadorEgypt, Arab Rep.El SalvadorEquatorial GuineaEritreaEstoniaEthiopiaEuro areaEurope & Central AsiaEurope & Central Asia (excluding high income)Europe & Central Asia (IDA & IBRD countries)European UnionFaroe IslandsFijiFinlandFragile and conflict affected situationsFranceFrench PolynesiaGabonGambia, TheGeorgiaGermanyGhanaGreeceGrenadaGuatemalaGuineaGuinea-BissauGuyanaHaitiHeavily indebted poor countries (HIPC)High incomeHondurasHong Kong SAR, ChinaHungaryIBRD onlyIcelandIDA & IBRD totalIDA blendIDA onlyIDA totalIndiaIndonesiaIran, Islamic Rep.IraqIrelandIsraelItalyJamaicaJapanJordanKazakhstanKenyaKiribatiKorea, Rep.KosovoKuwaitKyrgyz RepublicLao PDRLate-demographic dividendLatin America & Caribbean Latin America & Caribbean (excluding high income)Latin America & the Caribbean (IDA & IBRD countries)LatviaLeast developed countries: UN classificationLebanonLesothoLiberiaLibyaLithuaniaLow & middle incomeLow incomeLower middle incomeLuxembourgMacao SAR, ChinaMacedonia, FYRMadagascarMalawiMalaysiaMaldivesMaliMaltaMauritaniaMauritiusMexicoMicronesia, Fed. Sts.Middle East & North AfricaMiddle East & North Africa (excluding high income)Middle East & North Africa (IDA & IBRD countries)Middle incomeMoldovaMongoliaMontenegroMoroccoMozambiqueNamibiaNepalNetherlandsNew CaledoniaNew ZealandNicaraguaNigerNigeriaNorth AmericaNorwayOECD membersOmanOther small statesPakistanPanamaPapua New GuineaParaguayPeruPhilippinesPolandPortugalPost-demographic dividendPre-demographic dividendPuerto RicoQatarRomaniaRussian FederationRwandaSaudi ArabiaSenegalSerbiaSeychellesSierra LeoneSingaporeSlovak RepublicSloveniaSmall statesSolomon IslandsSomaliaSouth AfricaSouth AsiaSouth Asia (IDA & IBRD)South SudanSpainSri LankaSt. Kitts and NevisSt. LuciaSt. Vincent and the GrenadinesSub-Saharan Africa Sub-Saharan Africa (excluding high income)Sub-Saharan Africa (IDA & IBRD countries)SudanSurinameSwazilandSwedenSwitzerlandSyrian Arab RepublicTajikistanTanzaniaThailandTimor-LesteTogoTongaTrinidad and TobagoTunisiaTurkeyTurkmenistanUgandaUkraineUnited Arab EmiratesUnited KingdomUnited StatesUpper middle incomeUruguayUzbekistanVanuatuVenezuela, RBVietnamWest Bank and GazaWorldYemen, Rep.ZambiaZimbabwe Timeline:
This timeline shows a graph from 1989 to 2016 of Europe & Central Asia (excluding high income). No data until 1988. Number of actual observations by date: 28.
Source name:
World Development Indicators
Source organization:
World Bank national accounts data, and OECD National Accounts data files.
Categories, topics:
Economy & Growth
Last updated:
apr 23, 2017
Indicators value changes by year
Minimum:
90.048 bln
jan 1, 2000
Maximum:
716.599 bln
jan 1, 2014
At the date of observation
Value
Absolute change
Change from previous value
jan 1, 1989
148.018 bln
+148.018 bln
0.0%
jan 1, 1990
161.538 bln
+13.52 bln
9.13%
jan 1, 1991
178.756 bln
+17.218 bln
10.66%
jan 1, 1992
150.148 bln
-28.608 bln
-16.0%
jan 1, 1993
121.396 bln
-28.752 bln
-19.15%
jan 1, 1994
145.588 bln
+24.192 bln
19.93%
jan 1, 1995
123.152 bln
-22.436 bln
-15.41%
jan 1, 1996
128.12 bln
+4.968 bln
4.03%
jan 1, 1997
130.75 bln
+2.63 bln
2.05%
jan 1, 1998
147.867 bln
+17.117 bln
13.09%
jan 1, 1999
113.398 bln
-34.469 bln
-23.31%
jan 1, 2000
90.048 bln
-23.351 bln
-20.59%
jan 1, 2001
99.19 bln
+9.143 bln
10.15%
jan 1, 2002
106.974 bln
+7.784 bln
7.85%
jan 1, 2003
126.64 bln
+19.666 bln
18.38%
jan 1, 2004
160.574 bln
+33.934 bln
26.8%
jan 1, 2005
202.475 bln
+41.901 bln
26.09%
jan 1, 2006
256.063 bln
+53.589 bln
26.47%
jan 1, 2007
321.364 bln
+65.301 bln
25.5%
jan 1, 2008
416.941 bln
+95.576 bln
29.74%
jan 1, 2009
523.578 bln
+106.637 bln
25.58%
jan 1, 2010
464.257 bln
-59.322 bln
-11.33%
jan 1, 2011
514.819 bln
+50.563 bln
10.89%
jan 1, 2012
614.956 bln
+100.136 bln
19.45%
jan 1, 2013
663.067 bln
+48.112 bln
7.82%
jan 1, 2014
716.599 bln
+53.532 bln
8.07%
jan 1, 2015
652.01 bln
-64.59 bln
-9.01%
jan 1, 2016
482.567 bln
-169.442 bln
-25.99%
Ranking of countries by current statistics by years


Comments: