29
/
en
AIzaSyAYiBZKx7MnpbEhh9jyipgxe19OcubqV5w
April 1, 2024
211723
Niger
NER
true
2
1
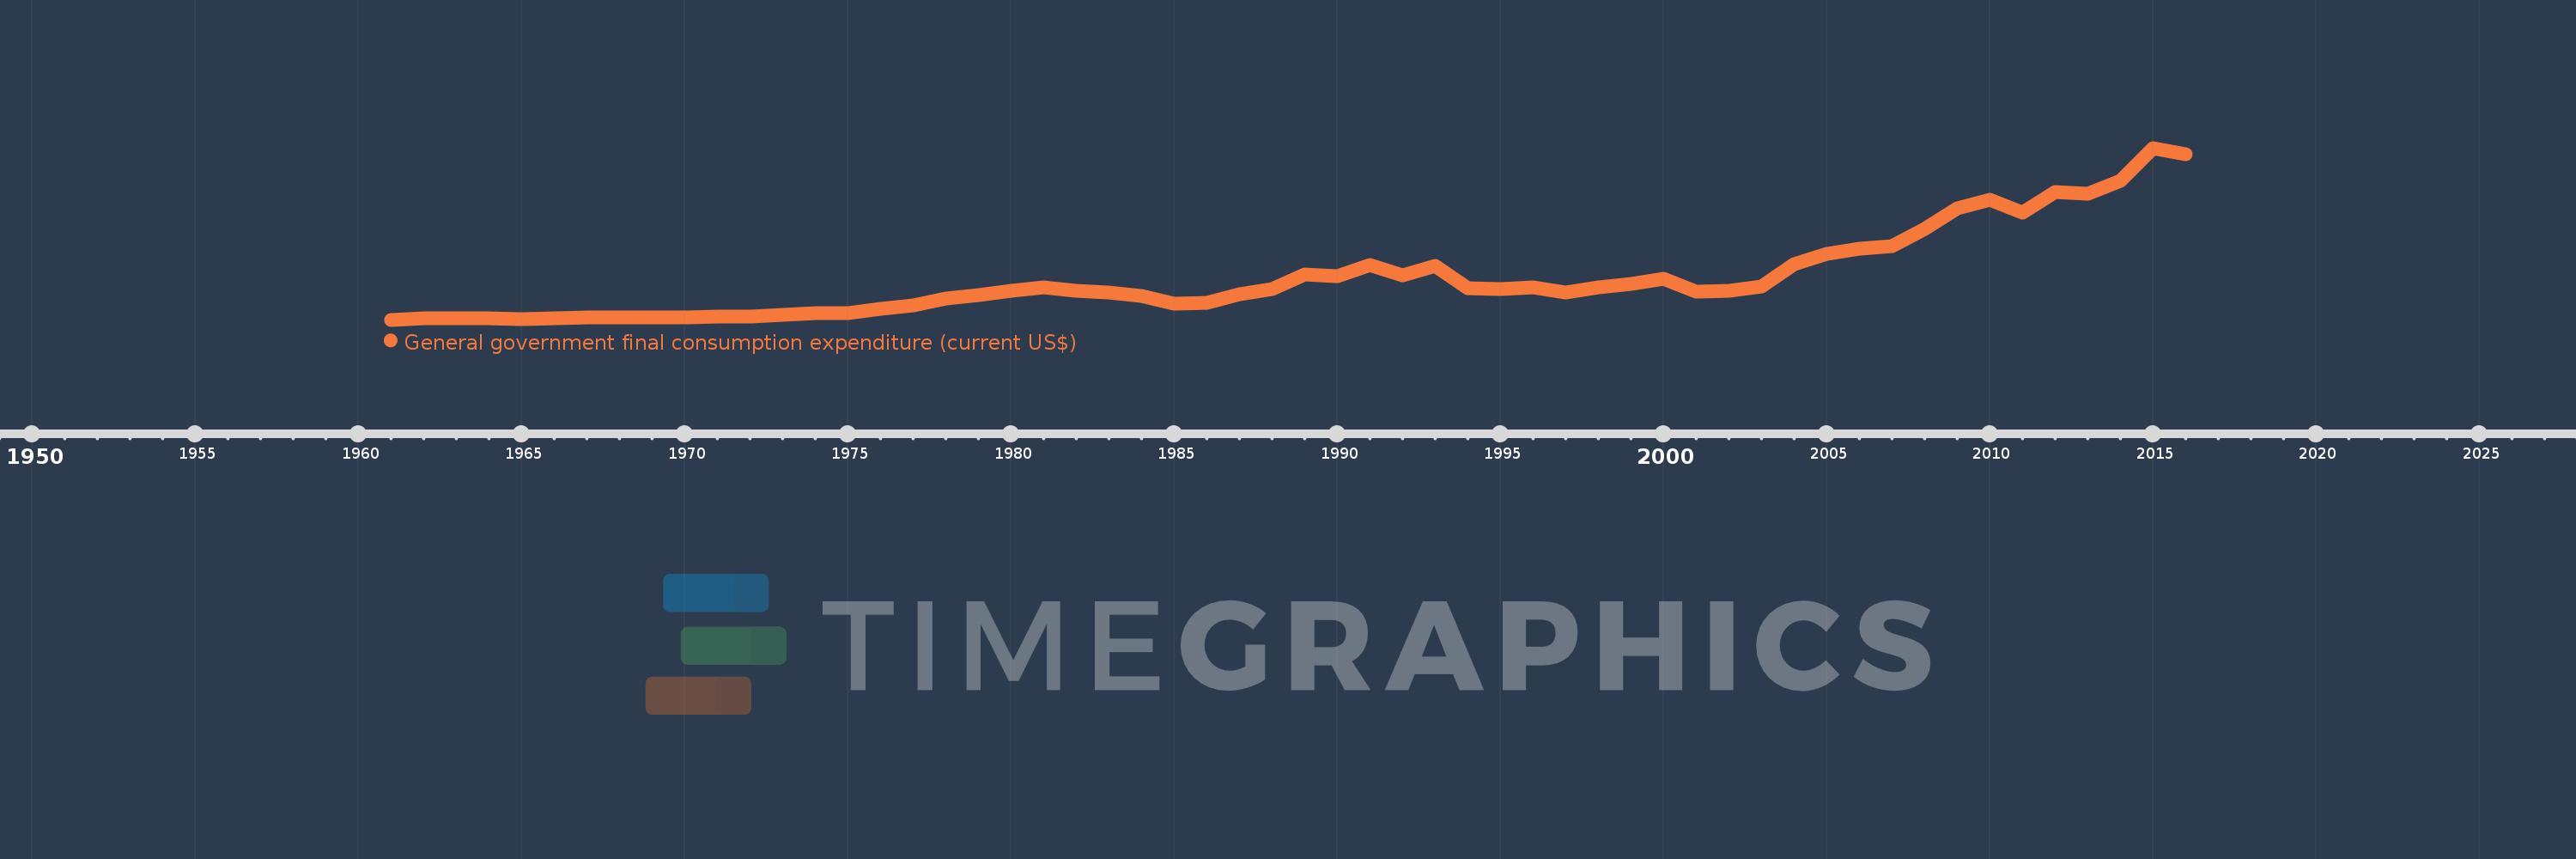
General government final consumption expenditure (current US$)
2016,2015,2014,2013,2012,2011,2010,2009,2008,2007,2006,2005,2004,2003,2002,2001,2000,1999,1998,1997,1996,1995,1994,1993,1992,1991,1990,1989,1988,1987,1986,1985,1984,1983,1982,1981,1980,1979,1978,1977,1976,1975,1974,1973,1972,1971,1970,1969,1968,1967,1966,1965,1964,1963,1962,1961
This statistics in other country:
AfghanistanAlbaniaAlgeriaAngolaAntigua and BarbudaArab WorldArgentinaArmeniaArubaAustraliaAustriaAzerbaijanBahamas, TheBahrainBangladeshBarbadosBelarusBelgiumBelizeBeninBermudaBhutanBoliviaBosnia and HerzegovinaBotswanaBrazilBrunei DarussalamBulgariaBurkina FasoBurundiCabo VerdeCambodiaCameroonCanadaCaribbean small statesCentral African RepublicCentral Europe and the BalticsChadChileChinaColombiaComorosCongo, Dem. Rep.Congo, Rep.Costa RicaCote d'IvoireCroatiaCubaCyprusCzech RepublicDenmarkDjiboutiDominicaDominican RepublicEarly-demographic dividendEast Asia & PacificEast Asia & Pacific (excluding high income)East Asia & Pacific (IDA & IBRD countries)EcuadorEgypt, Arab Rep.El SalvadorEquatorial GuineaEritreaEstoniaEthiopiaEuro areaEurope & Central AsiaEurope & Central Asia (excluding high income)Europe & Central Asia (IDA & IBRD countries)European UnionFaroe IslandsFijiFinlandFragile and conflict affected situationsFranceFrench PolynesiaGabonGambia, TheGeorgiaGermanyGhanaGreeceGrenadaGuatemalaGuineaGuinea-BissauGuyanaHaitiHeavily indebted poor countries (HIPC)High incomeHondurasHong Kong SAR, ChinaHungaryIBRD onlyIcelandIDA & IBRD totalIDA blendIDA onlyIDA totalIndiaIndonesiaIran, Islamic Rep.IraqIrelandIsraelItalyJamaicaJapanJordanKazakhstanKenyaKiribatiKorea, Rep.KosovoKuwaitKyrgyz RepublicLao PDRLate-demographic dividendLatin America & Caribbean Latin America & Caribbean (excluding high income)Latin America & the Caribbean (IDA & IBRD countries)LatviaLeast developed countries: UN classificationLebanonLesothoLiberiaLibyaLithuaniaLow & middle incomeLow incomeLower middle incomeLuxembourgMacao SAR, ChinaMacedonia, FYRMadagascarMalawiMalaysiaMaldivesMaliMaltaMauritaniaMauritiusMexicoMicronesia, Fed. Sts.Middle East & North AfricaMiddle East & North Africa (excluding high income)Middle East & North Africa (IDA & IBRD countries)Middle incomeMoldovaMongoliaMontenegroMoroccoMozambiqueNamibiaNepalNetherlandsNew CaledoniaNew ZealandNicaraguaNigerNigeriaNorth AmericaNorwayOECD membersOmanOther small statesPakistanPanamaPapua New GuineaParaguayPeruPhilippinesPolandPortugalPost-demographic dividendPre-demographic dividendPuerto RicoQatarRomaniaRussian FederationRwandaSaudi ArabiaSenegalSerbiaSeychellesSierra LeoneSingaporeSlovak RepublicSloveniaSmall statesSolomon IslandsSomaliaSouth AfricaSouth AsiaSouth Asia (IDA & IBRD)South SudanSpainSri LankaSt. Kitts and NevisSt. LuciaSt. Vincent and the GrenadinesSub-Saharan Africa Sub-Saharan Africa (excluding high income)Sub-Saharan Africa (IDA & IBRD countries)SudanSurinameSwazilandSwedenSwitzerlandSyrian Arab RepublicTajikistanTanzaniaThailandTimor-LesteTogoTongaTrinidad and TobagoTunisiaTurkeyTurkmenistanUgandaUkraineUnited Arab EmiratesUnited KingdomUnited StatesUpper middle incomeUruguayUzbekistanVanuatuVenezuela, RBVietnamWest Bank and GazaWorldYemen, Rep.ZambiaZimbabwe Timeline:
This timeline shows a graph from 1961 to 2016 of Niger. No data until 1960. Number of actual observations by date: 56.
Source name:
World Development Indicators
Source organization:
World Bank national accounts data, and OECD National Accounts data files.
Categories, topics:
Economy & Growth
Last updated:
apr 23, 2017
Indicators value changes by year
Minimum:
36.156 mln
jan 1, 1961
Maximum:
1.234 bln
jan 1, 2015
At the date of observation
Value
Absolute change
Change from previous value
jan 1, 1961
36.156 mln
+36.156 mln
0.0%
jan 1, 1962
44.872 mln
+8.716 mln
24.11%
jan 1, 1963
45.541 mln
+668.771K
1.49%
jan 1, 1964
44.293 mln
-1.248 mln
-2.74%
jan 1, 1965
43.043 mln
-1.249 mln
-2.82%
jan 1, 1966
43.658 mln
+614.39K
1.43%
jan 1, 1967
49.769 mln
+6.111 mln
14.0%
jan 1, 1968
53.432 mln
+3.662 mln
7.36%
jan 1, 1969
54.329 mln
+897.325K
1.68%
jan 1, 1970
54.678 mln
+349.077K
0.64%
jan 1, 1971
56.402 mln
+1.724 mln
3.15%
jan 1, 1972
57.171 mln
+769.312K
1.36%
jan 1, 1973
69.134 mln
+11.963 mln
20.93%
jan 1, 1974
81.601 mln
+12.467 mln
18.03%
jan 1, 1975
83.816 mln
+2.215 mln
2.71%
jan 1, 1976
113.393 mln
+29.577 mln
35.29%
jan 1, 1977
138.16 mln
+24.767 mln
21.84%
jan 1, 1978
184.767 mln
+46.607 mln
33.73%
jan 1, 1979
205.904 mln
+21.137 mln
11.44%
jan 1, 1980
240.697 mln
+34.793 mln
16.9%
jan 1, 1981
260.319 mln
+19.622 mln
8.15%
jan 1, 1982
237.367 mln
-22.952 mln
-8.82%
jan 1, 1983
228.237 mln
-9.13 mln
-3.85%
jan 1, 1984
202.59 mln
-25.647 mln
-11.24%
jan 1, 1985
149.214 mln
-53.376 mln
-26.35%
jan 1, 1986
156.033 mln
+6.819 mln
4.57%
jan 1, 1987
215.128 mln
+59.094 mln
37.87%
jan 1, 1988
250.552 mln
+35.424 mln
16.47%
jan 1, 1989
353.536 mln
+102.984 mln
41.1%
jan 1, 1990
342.311 mln
-11.225 mln
-3.18%
jan 1, 1991
416.47 mln
+74.159 mln
21.66%
jan 1, 1992
344.089 mln
-72.38 mln
-17.38%
jan 1, 1993
409.76 mln
+65.67 mln
19.09%
jan 1, 1994
253.66 mln
-156.1 mln
-38.1%
jan 1, 1995
249.548 mln
-4.112 mln
-1.62%
jan 1, 1996
262.11 mln
+12.563 mln
5.03%
jan 1, 1997
227.607 mln
-34.503 mln
-13.16%
jan 1, 1998
259.805 mln
+32.197 mln
14.15%
jan 1, 1999
283.664 mln
+23.859 mln
9.18%
jan 1, 2000
323.655 mln
+39.991 mln
14.1%
jan 1, 2001
234.489 mln
-89.166 mln
-27.55%
jan 1, 2002
240.905 mln
+6.416 mln
2.74%
jan 1, 2003
265.563 mln
+24.658 mln
10.24%
jan 1, 2004
425.592 mln
+160.029 mln
60.26%
jan 1, 2005
498.405 mln
+72.814 mln
17.11%
jan 1, 2006
531.122 mln
+32.717 mln
6.56%
jan 1, 2007
547.316 mln
+16.194 mln
3.05%
jan 1, 2008
671.578 mln
+124.262 mln
22.7%
jan 1, 2009
810.799 mln
+139.221 mln
20.73%
jan 1, 2010
874.608 mln
+63.809 mln
7.87%
jan 1, 2011
780.25 mln
-94.358 mln
-10.79%
jan 1, 2012
925.023 mln
+144.773 mln
18.55%
jan 1, 2013
917.644 mln
-7.379 mln
-0.8%
jan 1, 2014
1.008 bln
+90.24 mln
9.83%
jan 1, 2015
1.234 bln
+226.462 mln
22.47%
jan 1, 2016
1.191 bln
-43.013 mln
-3.48%
Ranking of countries by current statistics by years


Comments: