29
/
en
AIzaSyAYiBZKx7MnpbEhh9jyipgxe19OcubqV5w
April 1, 2024
253039
Sudan
SDN
true
2
1
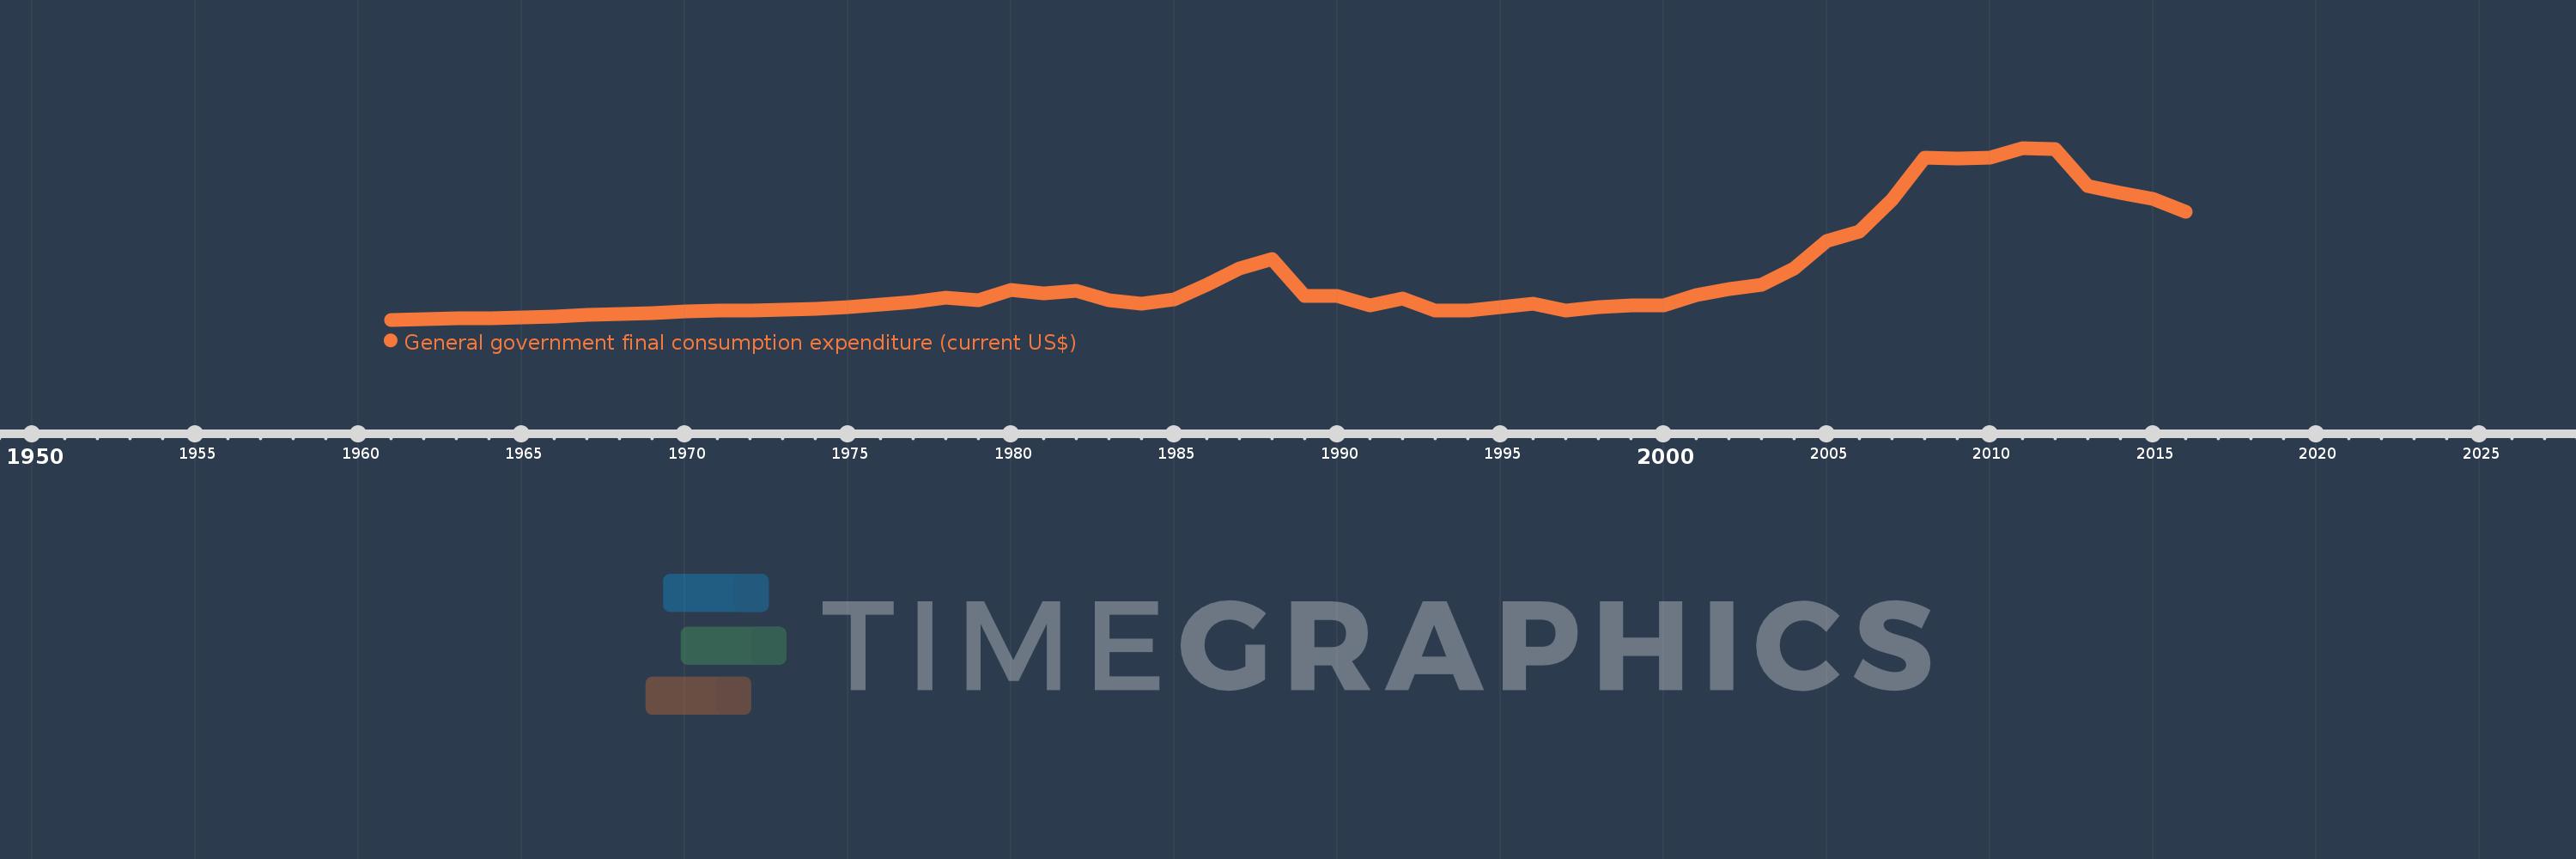
General government final consumption expenditure (current US$)
2016,2015,2014,2013,2012,2011,2010,2009,2008,2007,2006,2005,2004,2003,2002,2001,2000,1999,1998,1997,1996,1995,1994,1993,1992,1991,1990,1989,1988,1987,1986,1985,1984,1983,1982,1981,1980,1979,1978,1977,1976,1975,1974,1973,1972,1971,1970,1969,1968,1967,1966,1965,1964,1963,1962,1961
This statistics in other country:
AfghanistanAlbaniaAlgeriaAngolaAntigua and BarbudaArab WorldArgentinaArmeniaArubaAustraliaAustriaAzerbaijanBahamas, TheBahrainBangladeshBarbadosBelarusBelgiumBelizeBeninBermudaBhutanBoliviaBosnia and HerzegovinaBotswanaBrazilBrunei DarussalamBulgariaBurkina FasoBurundiCabo VerdeCambodiaCameroonCanadaCaribbean small statesCentral African RepublicCentral Europe and the BalticsChadChileChinaColombiaComorosCongo, Dem. Rep.Congo, Rep.Costa RicaCote d'IvoireCroatiaCubaCyprusCzech RepublicDenmarkDjiboutiDominicaDominican RepublicEarly-demographic dividendEast Asia & PacificEast Asia & Pacific (excluding high income)East Asia & Pacific (IDA & IBRD countries)EcuadorEgypt, Arab Rep.El SalvadorEquatorial GuineaEritreaEstoniaEthiopiaEuro areaEurope & Central AsiaEurope & Central Asia (excluding high income)Europe & Central Asia (IDA & IBRD countries)European UnionFaroe IslandsFijiFinlandFragile and conflict affected situationsFranceFrench PolynesiaGabonGambia, TheGeorgiaGermanyGhanaGreeceGrenadaGuatemalaGuineaGuinea-BissauGuyanaHaitiHeavily indebted poor countries (HIPC)High incomeHondurasHong Kong SAR, ChinaHungaryIBRD onlyIcelandIDA & IBRD totalIDA blendIDA onlyIDA totalIndiaIndonesiaIran, Islamic Rep.IraqIrelandIsraelItalyJamaicaJapanJordanKazakhstanKenyaKiribatiKorea, Rep.KosovoKuwaitKyrgyz RepublicLao PDRLate-demographic dividendLatin America & Caribbean Latin America & Caribbean (excluding high income)Latin America & the Caribbean (IDA & IBRD countries)LatviaLeast developed countries: UN classificationLebanonLesothoLiberiaLibyaLithuaniaLow & middle incomeLow incomeLower middle incomeLuxembourgMacao SAR, ChinaMacedonia, FYRMadagascarMalawiMalaysiaMaldivesMaliMaltaMauritaniaMauritiusMexicoMicronesia, Fed. Sts.Middle East & North AfricaMiddle East & North Africa (excluding high income)Middle East & North Africa (IDA & IBRD countries)Middle incomeMoldovaMongoliaMontenegroMoroccoMozambiqueNamibiaNepalNetherlandsNew CaledoniaNew ZealandNicaraguaNigerNigeriaNorth AmericaNorwayOECD membersOmanOther small statesPakistanPanamaPapua New GuineaParaguayPeruPhilippinesPolandPortugalPost-demographic dividendPre-demographic dividendPuerto RicoQatarRomaniaRussian FederationRwandaSaudi ArabiaSenegalSerbiaSeychellesSierra LeoneSingaporeSlovak RepublicSloveniaSmall statesSolomon IslandsSomaliaSouth AfricaSouth AsiaSouth Asia (IDA & IBRD)South SudanSpainSri LankaSt. Kitts and NevisSt. LuciaSt. Vincent and the GrenadinesSub-Saharan Africa Sub-Saharan Africa (excluding high income)Sub-Saharan Africa (IDA & IBRD countries)SudanSurinameSwazilandSwedenSwitzerlandSyrian Arab RepublicTajikistanTanzaniaThailandTimor-LesteTogoTongaTrinidad and TobagoTunisiaTurkeyTurkmenistanUgandaUkraineUnited Arab EmiratesUnited KingdomUnited StatesUpper middle incomeUruguayUzbekistanVanuatuVenezuela, RBVietnamWest Bank and GazaWorldYemen, Rep.ZambiaZimbabwe Timeline:
This timeline shows a graph from 1961 to 2016 of Sudan. No data until 1960. Number of actual observations by date: 56.
Source name:
World Development Indicators
Source organization:
World Bank national accounts data, and OECD National Accounts data files.
Categories, topics:
Economy & Growth
Last updated:
apr 23, 2017
Indicators value changes by year
Minimum:
127.0 mln
jan 1, 1961
Maximum:
7.009 bln
jan 1, 2011
At the date of observation
Value
Absolute change
Change from previous value
jan 1, 1961
127.0 mln
+127.0 mln
0.0%
jan 1, 1962
149.0 mln
+22.0 mln
17.32%
jan 1, 1963
173.667 mln
+24.667 mln
16.55%
jan 1, 1964
198.0 mln
+24.333 mln
14.01%
jan 1, 1965
231.0 mln
+33.0 mln
16.67%
jan 1, 1966
261.333 mln
+30.333 mln
13.13%
jan 1, 1967
331.333 mln
+70.0 mln
26.79%
jan 1, 1968
362.333 mln
+31.0 mln
9.36%
jan 1, 1969
408.0 mln
+45.667 mln
12.6%
jan 1, 1970
467.333 mln
+59.333 mln
14.54%
jan 1, 1971
512.333 mln
+45.0 mln
9.63%
jan 1, 1972
510.0 mln
-2.333 mln
-0.46%
jan 1, 1973
519.667 mln
+9.667 mln
1.9%
jan 1, 1974
576.667 mln
+57.0 mln
10.97%
jan 1, 1975
647.333 mln
+70.667 mln
12.25%
jan 1, 1976
729.667 mln
+82.333 mln
12.72%
jan 1, 1977
847.333 mln
+117.667 mln
16.13%
jan 1, 1978
1.016 bln
+168.333 mln
19.87%
jan 1, 1979
922.5 mln
-93.167 mln
-9.17%
jan 1, 1980
1.304 bln
+381.25 mln
41.33%
jan 1, 1981
1.191 bln
-112.583 mln
-8.64%
jan 1, 1982
1.293 bln
+102.167 mln
8.58%
jan 1, 1983
910.333 mln
-383.0 mln
-29.61%
jan 1, 1984
779.923 mln
-130.41 mln
-14.33%
jan 1, 1985
936.357 mln
+156.434 mln
20.06%
jan 1, 1986
1.531 bln
+594.643 mln
63.51%
jan 1, 1987
2.177 bln
+645.875 mln
42.19%
jan 1, 1988
2.573 bln
+395.903 mln
18.19%
jan 1, 1989
1.071 bln
-1.501 bln
-58.36%
jan 1, 1990
1.063 bln
-7.937 mln
-0.74%
jan 1, 1991
717.213 mln
-346.279 mln
-32.56%
jan 1, 1992
988.889 mln
+271.676 mln
37.88%
jan 1, 1993
511.294 mln
-477.595 mln
-48.3%
jan 1, 1994
496.547 mln
-14.746 mln
-2.88%
jan 1, 1995
618.612 mln
+122.064 mln
24.58%
jan 1, 1996
759.855 mln
+141.244 mln
22.83%
jan 1, 1997
501.279 mln
-258.576 mln
-34.03%
jan 1, 1998
632.735 mln
+131.455 mln
26.22%
jan 1, 1999
700.323 mln
+67.589 mln
10.68%
jan 1, 2000
692.065 mln
-8.259 mln
-1.18%
jan 1, 2001
1.113 bln
+420.647 mln
60.78%
jan 1, 2002
1.367 bln
+254.465 mln
22.87%
jan 1, 2003
1.54 bln
+172.892 mln
12.65%
jan 1, 2004
2.167 bln
+627.31 mln
40.73%
jan 1, 2005
3.286 bln
+1.118 bln
51.6%
jan 1, 2006
3.662 bln
+376.137 mln
11.45%
jan 1, 2007
4.945 bln
+1.283 bln
35.04%
jan 1, 2008
6.626 bln
+1.681 bln
33.99%
jan 1, 2009
6.571 bln
-55.039 mln
-0.83%
jan 1, 2010
6.634 bln
+62.841 mln
0.96%
jan 1, 2011
7.009 bln
+374.702 mln
5.65%
jan 1, 2012
6.955 bln
-53.196 mln
-0.76%
jan 1, 2013
5.478 bln
-1.478 bln
-21.24%
jan 1, 2014
5.214 bln
-263.96 mln
-4.82%
jan 1, 2015
4.97 bln
-244.2 mln
-4.68%
jan 1, 2016
4.449 bln
-520.563 mln
-10.47%
Ranking of countries by current statistics by years


Comments: