29
/
en
AIzaSyAYiBZKx7MnpbEhh9jyipgxe19OcubqV5w
April 1, 2024
50920
Middle income
MIC
false
2
1
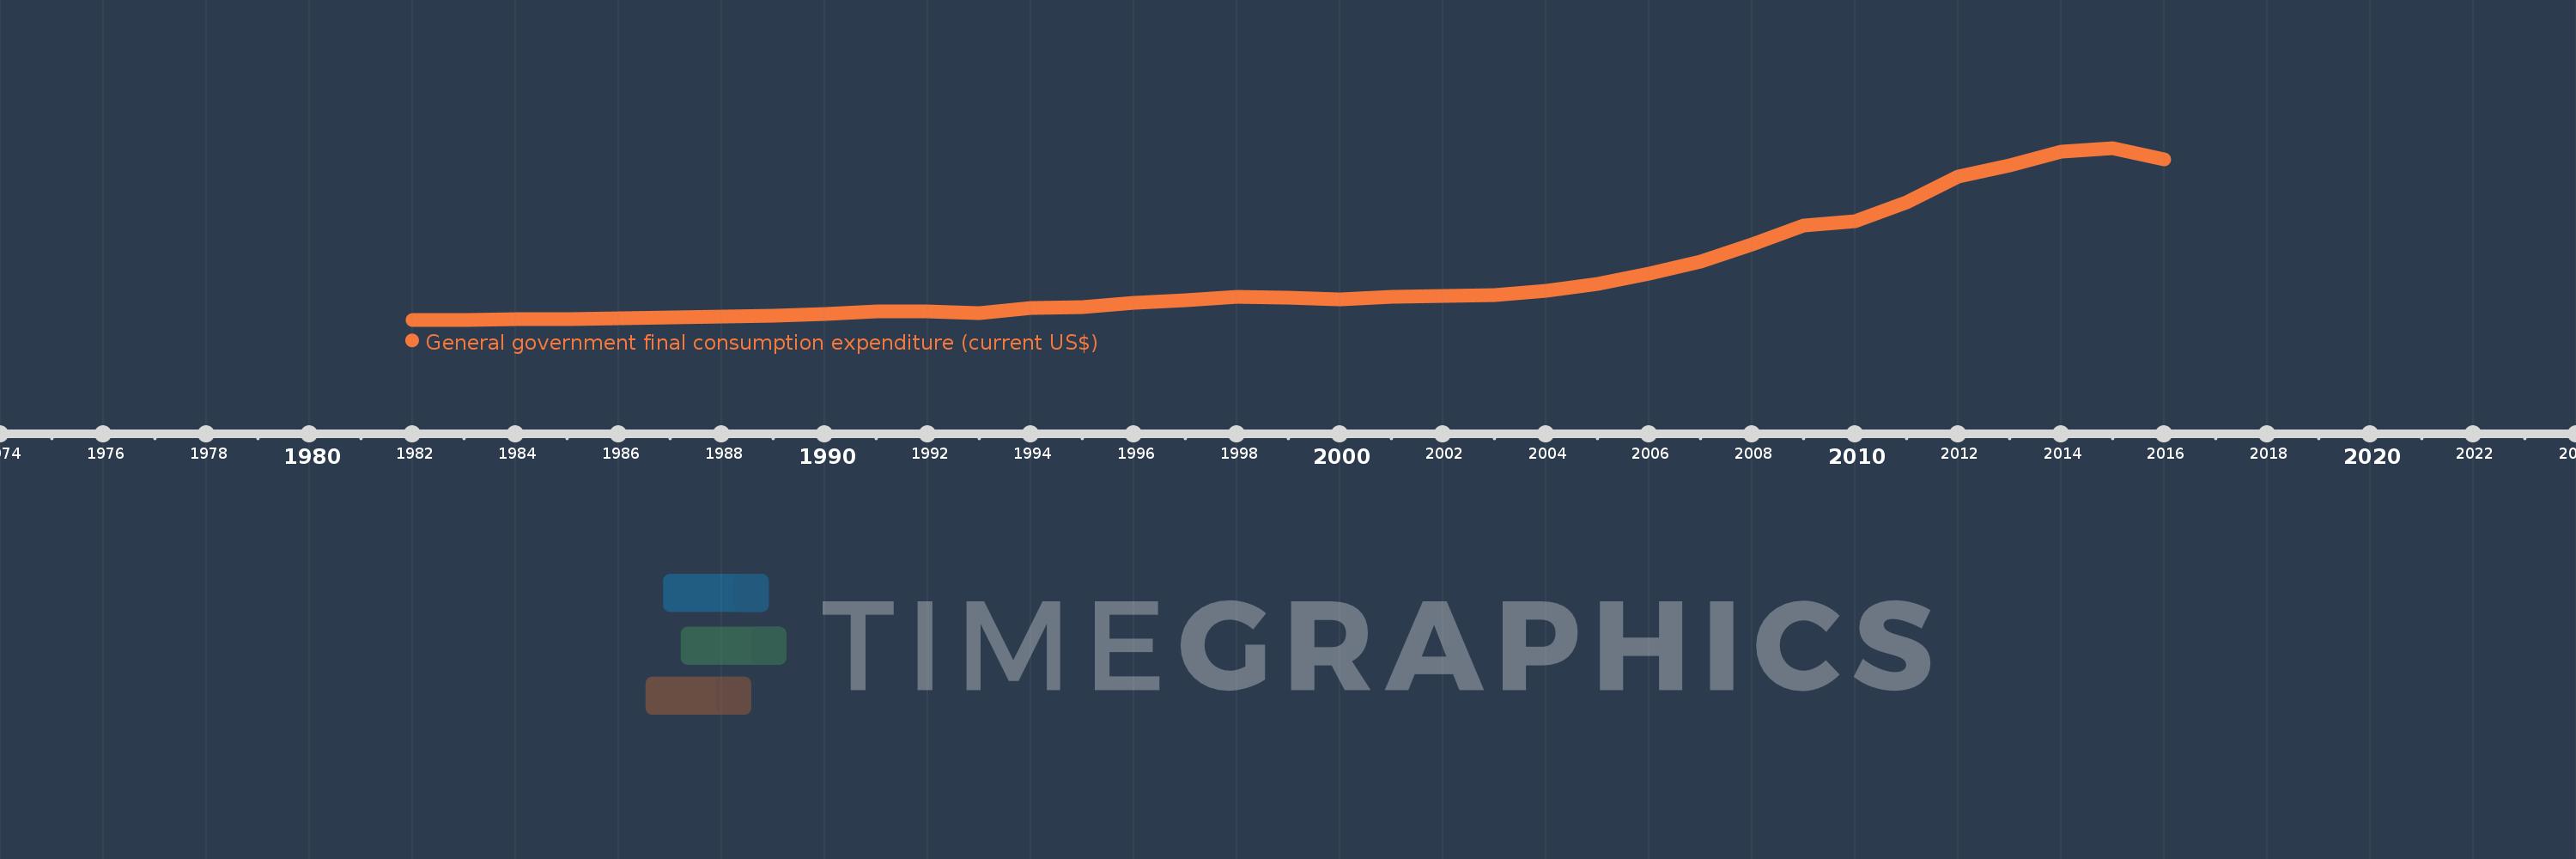
General government final consumption expenditure (current US$)
2016,2015,2014,2013,2012,2011,2010,2009,2008,2007,2006,2005,2004,2003,2002,2001,2000,1999,1998,1997,1996,1995,1994,1993,1992,1991,1990,1989,1988,1987,1986,1985,1984,1983,1982
This statistics in other country:
AfghanistanAlbaniaAlgeriaAngolaAntigua and BarbudaArab WorldArgentinaArmeniaArubaAustraliaAustriaAzerbaijanBahamas, TheBahrainBangladeshBarbadosBelarusBelgiumBelizeBeninBermudaBhutanBoliviaBosnia and HerzegovinaBotswanaBrazilBrunei DarussalamBulgariaBurkina FasoBurundiCabo VerdeCambodiaCameroonCanadaCaribbean small statesCentral African RepublicCentral Europe and the BalticsChadChileChinaColombiaComorosCongo, Dem. Rep.Congo, Rep.Costa RicaCote d'IvoireCroatiaCubaCyprusCzech RepublicDenmarkDjiboutiDominicaDominican RepublicEarly-demographic dividendEast Asia & PacificEast Asia & Pacific (excluding high income)East Asia & Pacific (IDA & IBRD countries)EcuadorEgypt, Arab Rep.El SalvadorEquatorial GuineaEritreaEstoniaEthiopiaEuro areaEurope & Central AsiaEurope & Central Asia (excluding high income)Europe & Central Asia (IDA & IBRD countries)European UnionFaroe IslandsFijiFinlandFragile and conflict affected situationsFranceFrench PolynesiaGabonGambia, TheGeorgiaGermanyGhanaGreeceGrenadaGuatemalaGuineaGuinea-BissauGuyanaHaitiHeavily indebted poor countries (HIPC)High incomeHondurasHong Kong SAR, ChinaHungaryIBRD onlyIcelandIDA & IBRD totalIDA blendIDA onlyIDA totalIndiaIndonesiaIran, Islamic Rep.IraqIrelandIsraelItalyJamaicaJapanJordanKazakhstanKenyaKiribatiKorea, Rep.KosovoKuwaitKyrgyz RepublicLao PDRLate-demographic dividendLatin America & Caribbean Latin America & Caribbean (excluding high income)Latin America & the Caribbean (IDA & IBRD countries)LatviaLeast developed countries: UN classificationLebanonLesothoLiberiaLibyaLithuaniaLow & middle incomeLow incomeLower middle incomeLuxembourgMacao SAR, ChinaMacedonia, FYRMadagascarMalawiMalaysiaMaldivesMaliMaltaMauritaniaMauritiusMexicoMicronesia, Fed. Sts.Middle East & North AfricaMiddle East & North Africa (excluding high income)Middle East & North Africa (IDA & IBRD countries)Middle incomeMoldovaMongoliaMontenegroMoroccoMozambiqueNamibiaNepalNetherlandsNew CaledoniaNew ZealandNicaraguaNigerNigeriaNorth AmericaNorwayOECD membersOmanOther small statesPakistanPanamaPapua New GuineaParaguayPeruPhilippinesPolandPortugalPost-demographic dividendPre-demographic dividendPuerto RicoQatarRomaniaRussian FederationRwandaSaudi ArabiaSenegalSerbiaSeychellesSierra LeoneSingaporeSlovak RepublicSloveniaSmall statesSolomon IslandsSomaliaSouth AfricaSouth AsiaSouth Asia (IDA & IBRD)South SudanSpainSri LankaSt. Kitts and NevisSt. LuciaSt. Vincent and the GrenadinesSub-Saharan Africa Sub-Saharan Africa (excluding high income)Sub-Saharan Africa (IDA & IBRD countries)SudanSurinameSwazilandSwedenSwitzerlandSyrian Arab RepublicTajikistanTanzaniaThailandTimor-LesteTogoTongaTrinidad and TobagoTunisiaTurkeyTurkmenistanUgandaUkraineUnited Arab EmiratesUnited KingdomUnited StatesUpper middle incomeUruguayUzbekistanVanuatuVenezuela, RBVietnamWest Bank and GazaWorldYemen, Rep.ZambiaZimbabwe Timeline:
This timeline shows a graph from 1982 to 2016 of Middle income. No data until 1981. Number of actual observations by date: 35.
Source name:
World Development Indicators
Source organization:
World Bank national accounts data, and OECD National Accounts data files.
Categories, topics:
Economy & Growth
Last updated:
apr 23, 2017
Indicators value changes by year
Minimum:
348.705 bln
jan 1, 1982
Maximum:
3.982 trl
jan 1, 2015
At the date of observation
Value
Absolute change
Change from previous value
jan 1, 1982
348.705 bln
+348.705 bln
0.0%
jan 1, 1983
351.267 bln
+2.562 bln
0.73%
jan 1, 1984
355.569 bln
+4.302 bln
1.22%
jan 1, 1985
358.43 bln
+2.861 bln
0.8%
jan 1, 1986
379.629 bln
+21.199 bln
5.91%
jan 1, 1987
403.931 bln
+24.302 bln
6.4%
jan 1, 1988
408.091 bln
+4.16 bln
1.03%
jan 1, 1989
429.839 bln
+21.748 bln
5.33%
jan 1, 1990
470.829 bln
+40.99 bln
9.54%
jan 1, 1991
521.754 bln
+50.925 bln
10.82%
jan 1, 1992
527.996 bln
+6.243 bln
1.2%
jan 1, 1993
492.962 bln
-35.035 bln
-6.64%
jan 1, 1994
591.417 bln
+98.455 bln
19.97%
jan 1, 1995
617.911 bln
+26.494 bln
4.48%
jan 1, 1996
706.008 bln
+88.097 bln
14.26%
jan 1, 1997
768.572 bln
+62.565 bln
8.86%
jan 1, 1998
839.802 bln
+71.229 bln
9.27%
jan 1, 1999
816.873 bln
-22.928 bln
-2.73%
jan 1, 2000
783.044 bln
-33.829 bln
-4.14%
jan 1, 2001
838.172 bln
+55.128 bln
7.04%
jan 1, 2002
854.853 bln
+16.681 bln
1.99%
jan 1, 2003
862.461 bln
+7.608 bln
0.89%
jan 1, 2004
954.96 bln
+92.499 bln
10.73%
jan 1, 2005
1.101 trl
+146.395 bln
15.33%
jan 1, 2006
1.32 trl
+218.363 bln
19.83%
jan 1, 2007
1.57 trl
+250.566 bln
18.99%
jan 1, 2008
1.936 trl
+365.778 bln
23.29%
jan 1, 2009
2.349 trl
+412.512 bln
21.31%
jan 1, 2010
2.43 trl
+81.64 bln
3.48%
jan 1, 2011
2.839 trl
+409.18 bln
16.84%
jan 1, 2012
3.373 trl
+533.341 bln
18.78%
jan 1, 2013
3.617 trl
+243.842 bln
7.23%
jan 1, 2014
3.904 trl
+287.278 bln
7.94%
jan 1, 2015
3.982 trl
+77.874 bln
1.99%
jan 1, 2016
3.747 trl
-234.91 bln
-5.9%
Ranking of countries by current statistics by years


Comments: