29
/
en
AIzaSyAYiBZKx7MnpbEhh9jyipgxe19OcubqV5w
April 1, 2024
69826
Argentina
ARG
true
2
1
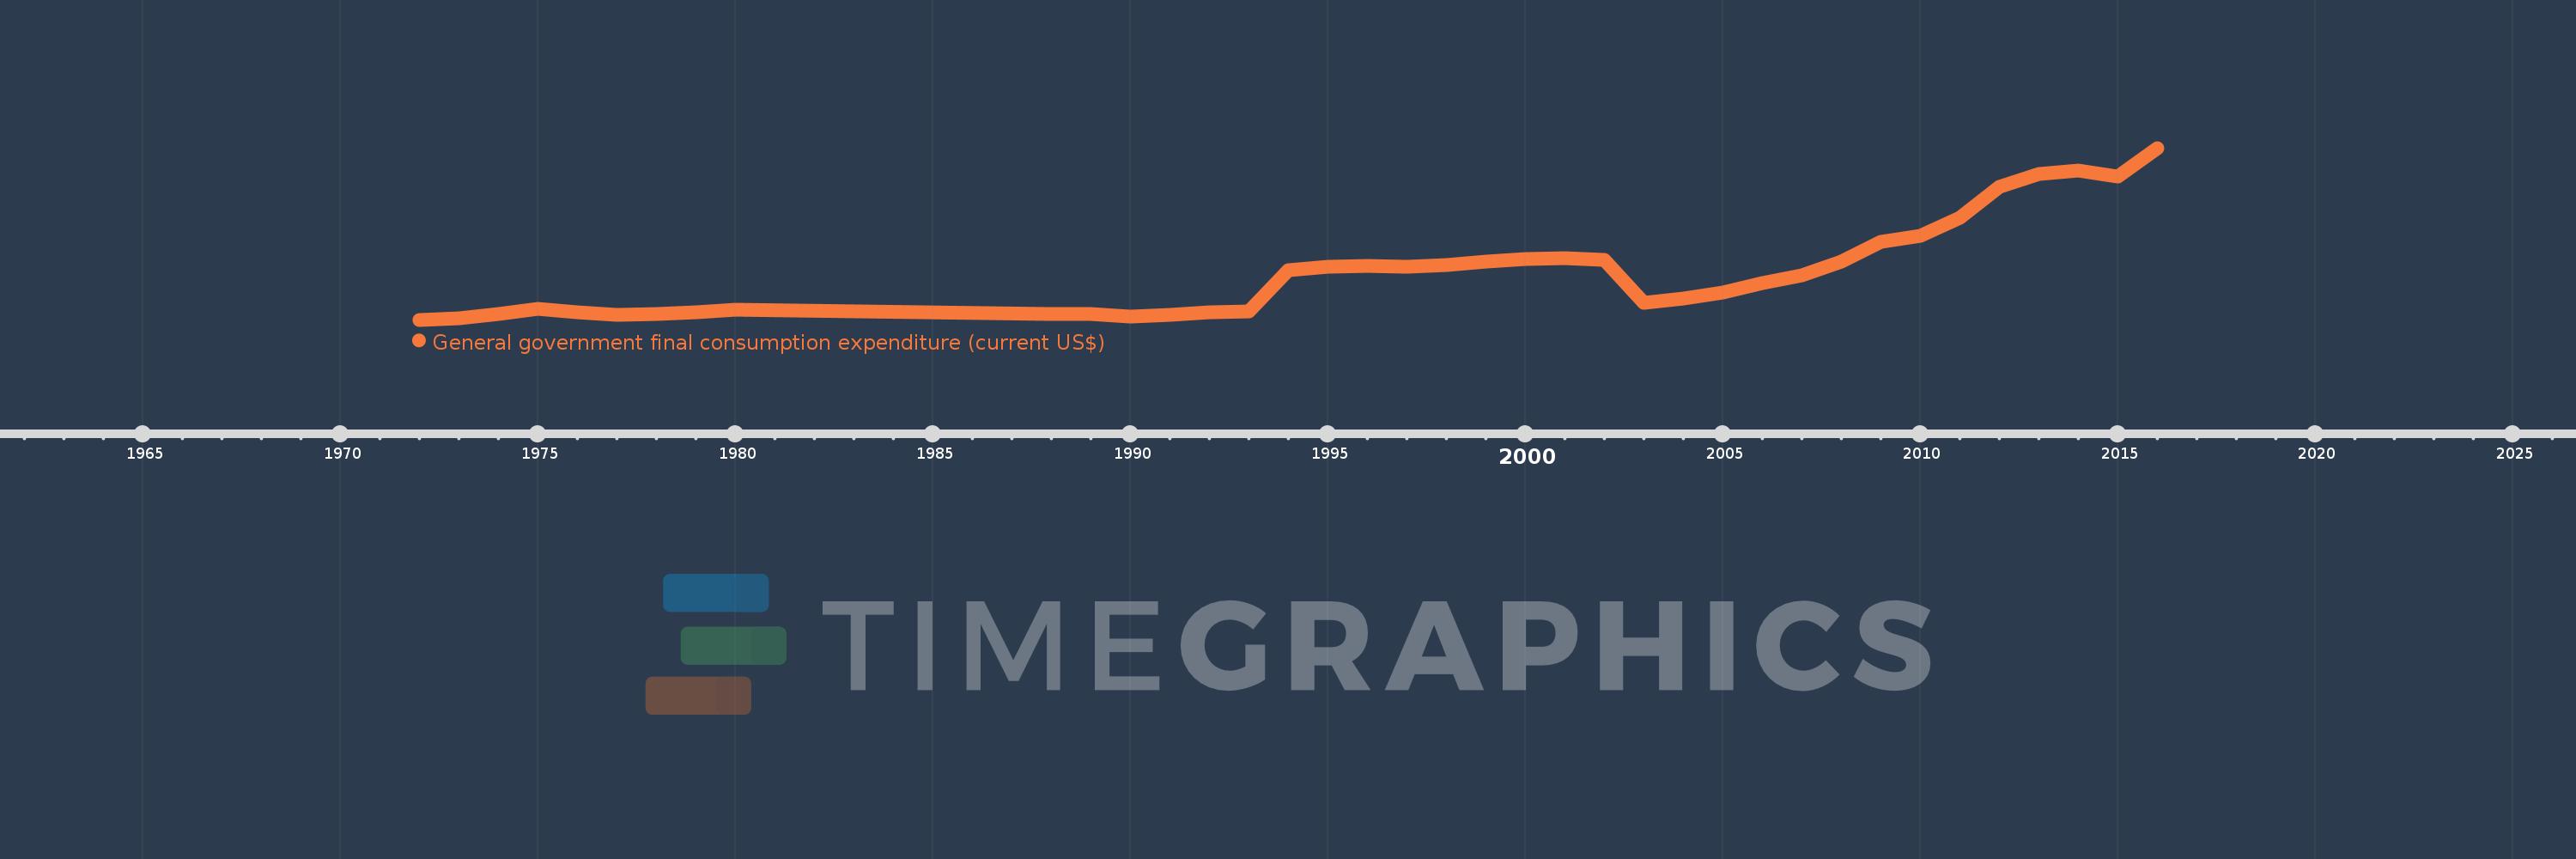
General government final consumption expenditure (current US$)
2016,2015,2014,2013,2012,2011,2010,2009,2008,2007,2006,2005,2004,2003,2002,2001,2000,1999,1998,1997,1996,1995,1994,1993,1992,1991,1990,1989,1988,1980,1979,1978,1977,1976,1975,1974,1973,1972
This statistics in other country:
AfghanistanAlbaniaAlgeriaAngolaAntigua and BarbudaArab WorldArgentinaArmeniaArubaAustraliaAustriaAzerbaijanBahamas, TheBahrainBangladeshBarbadosBelarusBelgiumBelizeBeninBermudaBhutanBoliviaBosnia and HerzegovinaBotswanaBrazilBrunei DarussalamBulgariaBurkina FasoBurundiCabo VerdeCambodiaCameroonCanadaCaribbean small statesCentral African RepublicCentral Europe and the BalticsChadChileChinaColombiaComorosCongo, Dem. Rep.Congo, Rep.Costa RicaCote d'IvoireCroatiaCubaCyprusCzech RepublicDenmarkDjiboutiDominicaDominican RepublicEarly-demographic dividendEast Asia & PacificEast Asia & Pacific (excluding high income)East Asia & Pacific (IDA & IBRD countries)EcuadorEgypt, Arab Rep.El SalvadorEquatorial GuineaEritreaEstoniaEthiopiaEuro areaEurope & Central AsiaEurope & Central Asia (excluding high income)Europe & Central Asia (IDA & IBRD countries)European UnionFaroe IslandsFijiFinlandFragile and conflict affected situationsFranceFrench PolynesiaGabonGambia, TheGeorgiaGermanyGhanaGreeceGrenadaGuatemalaGuineaGuinea-BissauGuyanaHaitiHeavily indebted poor countries (HIPC)High incomeHondurasHong Kong SAR, ChinaHungaryIBRD onlyIcelandIDA & IBRD totalIDA blendIDA onlyIDA totalIndiaIndonesiaIran, Islamic Rep.IraqIrelandIsraelItalyJamaicaJapanJordanKazakhstanKenyaKiribatiKorea, Rep.KosovoKuwaitKyrgyz RepublicLao PDRLate-demographic dividendLatin America & Caribbean Latin America & Caribbean (excluding high income)Latin America & the Caribbean (IDA & IBRD countries)LatviaLeast developed countries: UN classificationLebanonLesothoLiberiaLibyaLithuaniaLow & middle incomeLow incomeLower middle incomeLuxembourgMacao SAR, ChinaMacedonia, FYRMadagascarMalawiMalaysiaMaldivesMaliMaltaMauritaniaMauritiusMexicoMicronesia, Fed. Sts.Middle East & North AfricaMiddle East & North Africa (excluding high income)Middle East & North Africa (IDA & IBRD countries)Middle incomeMoldovaMongoliaMontenegroMoroccoMozambiqueNamibiaNepalNetherlandsNew CaledoniaNew ZealandNicaraguaNigerNigeriaNorth AmericaNorwayOECD membersOmanOther small statesPakistanPanamaPapua New GuineaParaguayPeruPhilippinesPolandPortugalPost-demographic dividendPre-demographic dividendPuerto RicoQatarRomaniaRussian FederationRwandaSaudi ArabiaSenegalSerbiaSeychellesSierra LeoneSingaporeSlovak RepublicSloveniaSmall statesSolomon IslandsSomaliaSouth AfricaSouth AsiaSouth Asia (IDA & IBRD)South SudanSpainSri LankaSt. Kitts and NevisSt. LuciaSt. Vincent and the GrenadinesSub-Saharan Africa Sub-Saharan Africa (excluding high income)Sub-Saharan Africa (IDA & IBRD countries)SudanSurinameSwazilandSwedenSwitzerlandSyrian Arab RepublicTajikistanTanzaniaThailandTimor-LesteTogoTongaTrinidad and TobagoTunisiaTurkeyTurkmenistanUgandaUkraineUnited Arab EmiratesUnited KingdomUnited StatesUpper middle incomeUruguayUzbekistanVanuatuVenezuela, RBVietnamWest Bank and GazaWorldYemen, Rep.ZambiaZimbabwe Timeline:
This timeline shows a graph from 1972 to 2016 of Argentina. No data until 1971. Number of actual observations by date: 38.
Source name:
World Development Indicators
Source organization:
World Bank national accounts data, and OECD National Accounts data files.
Categories, topics:
Economy & Growth
Last updated:
apr 23, 2017
Indicators value changes by year
Minimum:
1.689 bln
jan 1, 1972
Maximum:
106.703 bln
jan 1, 2016
At the date of observation
Value
Absolute change
Change from previous value
jan 1, 1972
1.689 bln
+1.689 bln
0.0%
jan 1, 1973
2.598 bln
+909.5 mln
53.85%
jan 1, 1974
5.457 bln
+2.858 bln
110.0%
jan 1, 1975
8.575 bln
+3.118 bln
57.14%
jan 1, 1976
6.106 bln
-2.469 bln
-28.79%
jan 1, 1977
4.82 bln
-1.286 bln
-21.06%
jan 1, 1978
5.119 bln
+298.825 mln
6.2%
jan 1, 1979
6.486 bln
+1.367 bln
26.7%
jan 1, 1980
7.623 bln
+1.138 bln
17.54%
jan 1, 1988
5.238 bln
-2.385 bln
-31.29%
jan 1, 1989
5.455 bln
+216.45 mln
4.13%
jan 1, 1990
3.444 bln
-2.01 bln
-36.85%
jan 1, 1991
4.432 bln
+987.637 mln
28.67%
jan 1, 1992
6.302 bln
+1.87 bln
42.19%
jan 1, 1993
6.808 bln
+505.647 mln
8.02%
jan 1, 1994
31.985 bln
+25.177 bln
369.83%
jan 1, 1995
33.948 bln
+1.964 bln
6.14%
jan 1, 1996
34.446 bln
+497.75 mln
1.47%
jan 1, 1997
34.023 bln
-422.75 mln
-1.23%
jan 1, 1998
35.325 bln
+1.302 bln
3.83%
jan 1, 1999
37.353 bln
+2.028 bln
5.74%
jan 1, 2000
38.908 bln
+1.556 bln
4.16%
jan 1, 2001
39.175 bln
+266.75 mln
0.69%
jan 1, 2002
38.038 bln
-1.138 bln
-2.9%
jan 1, 2003
11.957 bln
-26.081 bln
-68.57%
jan 1, 2004
14.594 bln
+2.637 bln
22.05%
jan 1, 2005
18.301 bln
+3.708 bln
25.41%
jan 1, 2006
24.13 bln
+5.829 bln
31.85%
jan 1, 2007
28.906 bln
+4.775 bln
19.79%
jan 1, 2008
37.348 bln
+8.443 bln
29.21%
jan 1, 2009
49.293 bln
+11.945 bln
31.98%
jan 1, 2010
52.956 bln
+3.663 bln
7.43%
jan 1, 2011
64.238 bln
+11.281 bln
21.3%
jan 1, 2012
83.177 bln
+18.939 bln
29.48%
jan 1, 2013
90.881 bln
+7.704 bln
9.26%
jan 1, 2014
92.774 bln
+1.894 bln
2.08%
jan 1, 2015
89.21 bln
-3.564 bln
-3.84%
jan 1, 2016
106.703 bln
+17.493 bln
19.61%
Ranking of countries by current statistics by years


Comments: