29
/
en
AIzaSyAYiBZKx7MnpbEhh9jyipgxe19OcubqV5w
April 1, 2024
113599
Cote d'Ivoire
CIV
true
2
1
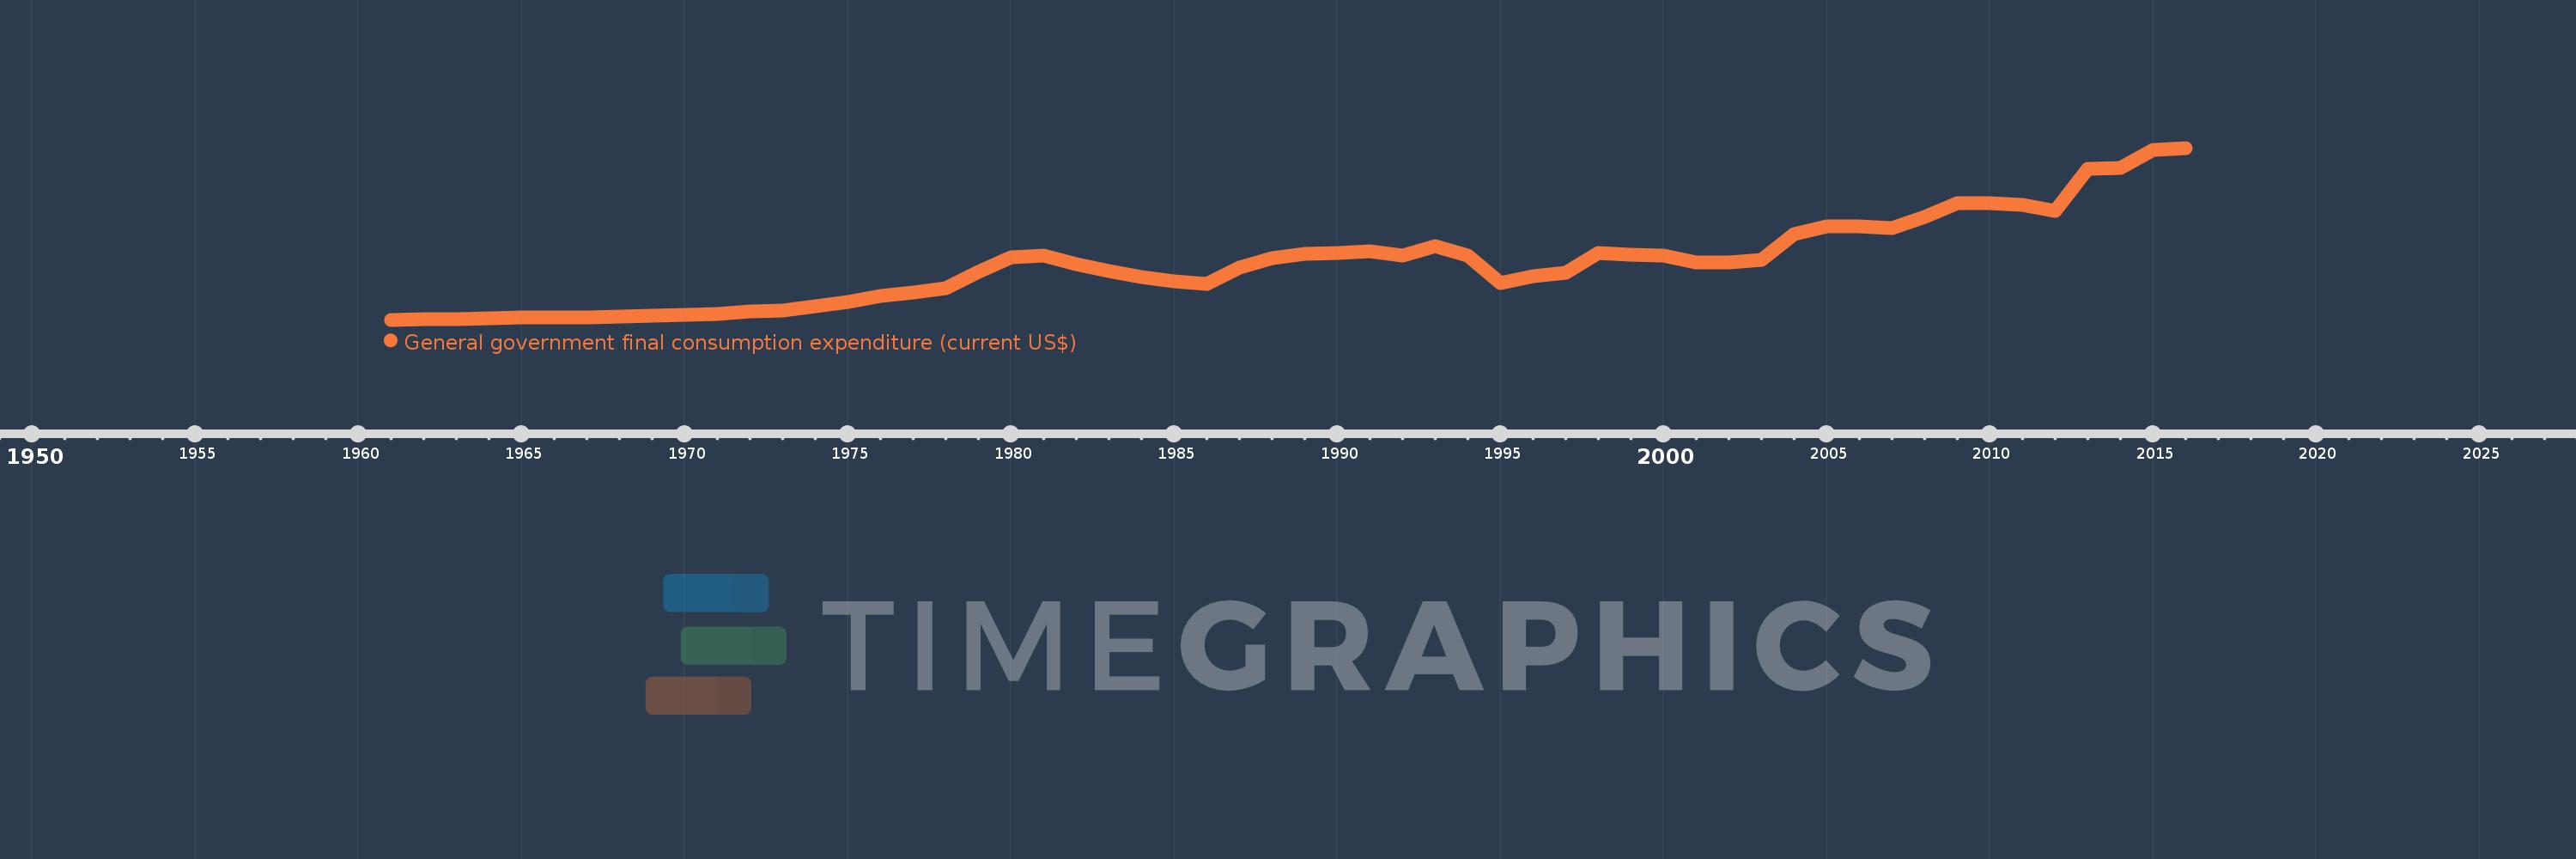
General government final consumption expenditure (current US$)
2016,2015,2014,2013,2012,2011,2010,2009,2008,2007,2006,2005,2004,2003,2002,2001,2000,1999,1998,1997,1996,1995,1994,1993,1992,1991,1990,1989,1988,1987,1986,1985,1984,1983,1982,1981,1980,1979,1978,1977,1976,1975,1974,1973,1972,1971,1970,1969,1968,1967,1966,1965,1964,1963,1962,1961
This statistics in other country:
AfghanistanAlbaniaAlgeriaAngolaAntigua and BarbudaArab WorldArgentinaArmeniaArubaAustraliaAustriaAzerbaijanBahamas, TheBahrainBangladeshBarbadosBelarusBelgiumBelizeBeninBermudaBhutanBoliviaBosnia and HerzegovinaBotswanaBrazilBrunei DarussalamBulgariaBurkina FasoBurundiCabo VerdeCambodiaCameroonCanadaCaribbean small statesCentral African RepublicCentral Europe and the BalticsChadChileChinaColombiaComorosCongo, Dem. Rep.Congo, Rep.Costa RicaCote d'IvoireCroatiaCubaCyprusCzech RepublicDenmarkDjiboutiDominicaDominican RepublicEarly-demographic dividendEast Asia & PacificEast Asia & Pacific (excluding high income)East Asia & Pacific (IDA & IBRD countries)EcuadorEgypt, Arab Rep.El SalvadorEquatorial GuineaEritreaEstoniaEthiopiaEuro areaEurope & Central AsiaEurope & Central Asia (excluding high income)Europe & Central Asia (IDA & IBRD countries)European UnionFaroe IslandsFijiFinlandFragile and conflict affected situationsFranceFrench PolynesiaGabonGambia, TheGeorgiaGermanyGhanaGreeceGrenadaGuatemalaGuineaGuinea-BissauGuyanaHaitiHeavily indebted poor countries (HIPC)High incomeHondurasHong Kong SAR, ChinaHungaryIBRD onlyIcelandIDA & IBRD totalIDA blendIDA onlyIDA totalIndiaIndonesiaIran, Islamic Rep.IraqIrelandIsraelItalyJamaicaJapanJordanKazakhstanKenyaKiribatiKorea, Rep.KosovoKuwaitKyrgyz RepublicLao PDRLate-demographic dividendLatin America & Caribbean Latin America & Caribbean (excluding high income)Latin America & the Caribbean (IDA & IBRD countries)LatviaLeast developed countries: UN classificationLebanonLesothoLiberiaLibyaLithuaniaLow & middle incomeLow incomeLower middle incomeLuxembourgMacao SAR, ChinaMacedonia, FYRMadagascarMalawiMalaysiaMaldivesMaliMaltaMauritaniaMauritiusMexicoMicronesia, Fed. Sts.Middle East & North AfricaMiddle East & North Africa (excluding high income)Middle East & North Africa (IDA & IBRD countries)Middle incomeMoldovaMongoliaMontenegroMoroccoMozambiqueNamibiaNepalNetherlandsNew CaledoniaNew ZealandNicaraguaNigerNigeriaNorth AmericaNorwayOECD membersOmanOther small statesPakistanPanamaPapua New GuineaParaguayPeruPhilippinesPolandPortugalPost-demographic dividendPre-demographic dividendPuerto RicoQatarRomaniaRussian FederationRwandaSaudi ArabiaSenegalSerbiaSeychellesSierra LeoneSingaporeSlovak RepublicSloveniaSmall statesSolomon IslandsSomaliaSouth AfricaSouth AsiaSouth Asia (IDA & IBRD)South SudanSpainSri LankaSt. Kitts and NevisSt. LuciaSt. Vincent and the GrenadinesSub-Saharan Africa Sub-Saharan Africa (excluding high income)Sub-Saharan Africa (IDA & IBRD countries)SudanSurinameSwazilandSwedenSwitzerlandSyrian Arab RepublicTajikistanTanzaniaThailandTimor-LesteTogoTongaTrinidad and TobagoTunisiaTurkeyTurkmenistanUgandaUkraineUnited Arab EmiratesUnited KingdomUnited StatesUpper middle incomeUruguayUzbekistanVanuatuVenezuela, RBVietnamWest Bank and GazaWorldYemen, Rep.ZambiaZimbabwe Timeline:
This timeline shows a graph from 1961 to 2016 of Cote d'Ivoire. No data until 1960. Number of actual observations by date: 56.
Source name:
World Development Indicators
Source organization:
World Bank national accounts data, and OECD National Accounts data files.
Categories, topics:
Economy & Growth
Last updated:
apr 23, 2017
Indicators value changes by year
Minimum:
43.358 mln
jan 1, 1961
Maximum:
4.498 bln
jan 1, 2016
At the date of observation
Value
Absolute change
Change from previous value
jan 1, 1961
43.358 mln
+43.358 mln
0.0%
jan 1, 1962
54.847 mln
+11.489 mln
26.5%
jan 1, 1963
61.101 mln
+6.254 mln
11.4%
jan 1, 1964
71.726 mln
+10.625 mln
17.39%
jan 1, 1965
92.384 mln
+20.658 mln
28.8%
jan 1, 1966
99.159 mln
+6.775 mln
7.33%
jan 1, 1967
109.9 mln
+10.741 mln
10.83%
jan 1, 1968
118.699 mln
+8.799 mln
8.01%
jan 1, 1969
143.801 mln
+25.102 mln
21.15%
jan 1, 1970
166.179 mln
+22.378 mln
15.56%
jan 1, 1971
197.538 mln
+31.359 mln
18.87%
jan 1, 1972
252.4 mln
+54.862 mln
27.77%
jan 1, 1973
288.46 mln
+36.06 mln
14.29%
jan 1, 1974
395.263 mln
+106.804 mln
37.03%
jan 1, 1975
497.29 mln
+102.027 mln
25.81%
jan 1, 1976
661.649 mln
+164.36 mln
33.05%
jan 1, 1977
754.55 mln
+92.9 mln
14.04%
jan 1, 1978
853.55 mln
+99.001 mln
13.12%
jan 1, 1979
1.287 bln
+433.365 mln
50.77%
jan 1, 1980
1.663 bln
+376.292 mln
29.24%
jan 1, 1981
1.715 bln
+52.056 mln
3.13%
jan 1, 1982
1.485 bln
-229.973 mln
-13.41%
jan 1, 1983
1.316 bln
-169.125 mln
-11.39%
jan 1, 1984
1.153 bln
-163.346 mln
-12.41%
jan 1, 1985
1.037 bln
-115.416 mln
-10.01%
jan 1, 1986
982.943 mln
-54.459 mln
-5.25%
jan 1, 1987
1.385 bln
+402.537 mln
40.95%
jan 1, 1988
1.644 bln
+258.246 mln
18.64%
jan 1, 1989
1.754 bln
+110.187 mln
6.7%
jan 1, 1990
1.781 bln
+27.231 mln
1.55%
jan 1, 1991
1.814 bln
+32.531 mln
1.83%
jan 1, 1992
1.717 bln
-96.95 mln
-5.35%
jan 1, 1993
1.945 bln
+228.556 mln
13.31%
jan 1, 1994
1.709 bln
-236.016 mln
-12.13%
jan 1, 1995
999.631 mln
-709.634 mln
-41.52%
jan 1, 1996
1.167 bln
+167.291 mln
16.74%
jan 1, 1997
1.27 bln
+102.836 mln
8.81%
jan 1, 1998
1.764 bln
+493.839 mln
38.89%
jan 1, 1999
1.73 bln
-33.446 mln
-1.9%
jan 1, 2000
1.713 bln
-16.675 mln
-0.96%
jan 1, 2001
1.538 bln
-175.475 mln
-10.24%
jan 1, 2002
1.524 bln
-14.142 mln
-0.92%
jan 1, 2003
1.602 bln
+78.408 mln
5.15%
jan 1, 2004
2.266 bln
+663.637 mln
41.42%
jan 1, 2005
2.466 bln
+199.884 mln
8.82%
jan 1, 2006
2.465 bln
-870.555K
-0.04%
jan 1, 2007
2.419 bln
-45.491 mln
-1.85%
jan 1, 2008
2.714 bln
+294.123 mln
12.16%
jan 1, 2009
3.069 bln
+355.687 mln
13.11%
jan 1, 2010
3.068 bln
-1.692 mln
-0.06%
jan 1, 2011
3.03 bln
-37.213 mln
-1.21%
jan 1, 2012
2.854 bln
-175.881 mln
-5.8%
jan 1, 2013
3.967 bln
+1.113 bln
38.99%
jan 1, 2014
3.984 bln
+16.919 mln
0.43%
jan 1, 2015
4.456 bln
+472.259 mln
11.85%
jan 1, 2016
4.498 bln
+41.224 mln
0.93%
Ranking of countries by current statistics by years


Comments: