29
/
en
AIzaSyAYiBZKx7MnpbEhh9jyipgxe19OcubqV5w
April 1, 2024
212974
Nigeria
NGA
true
2
1
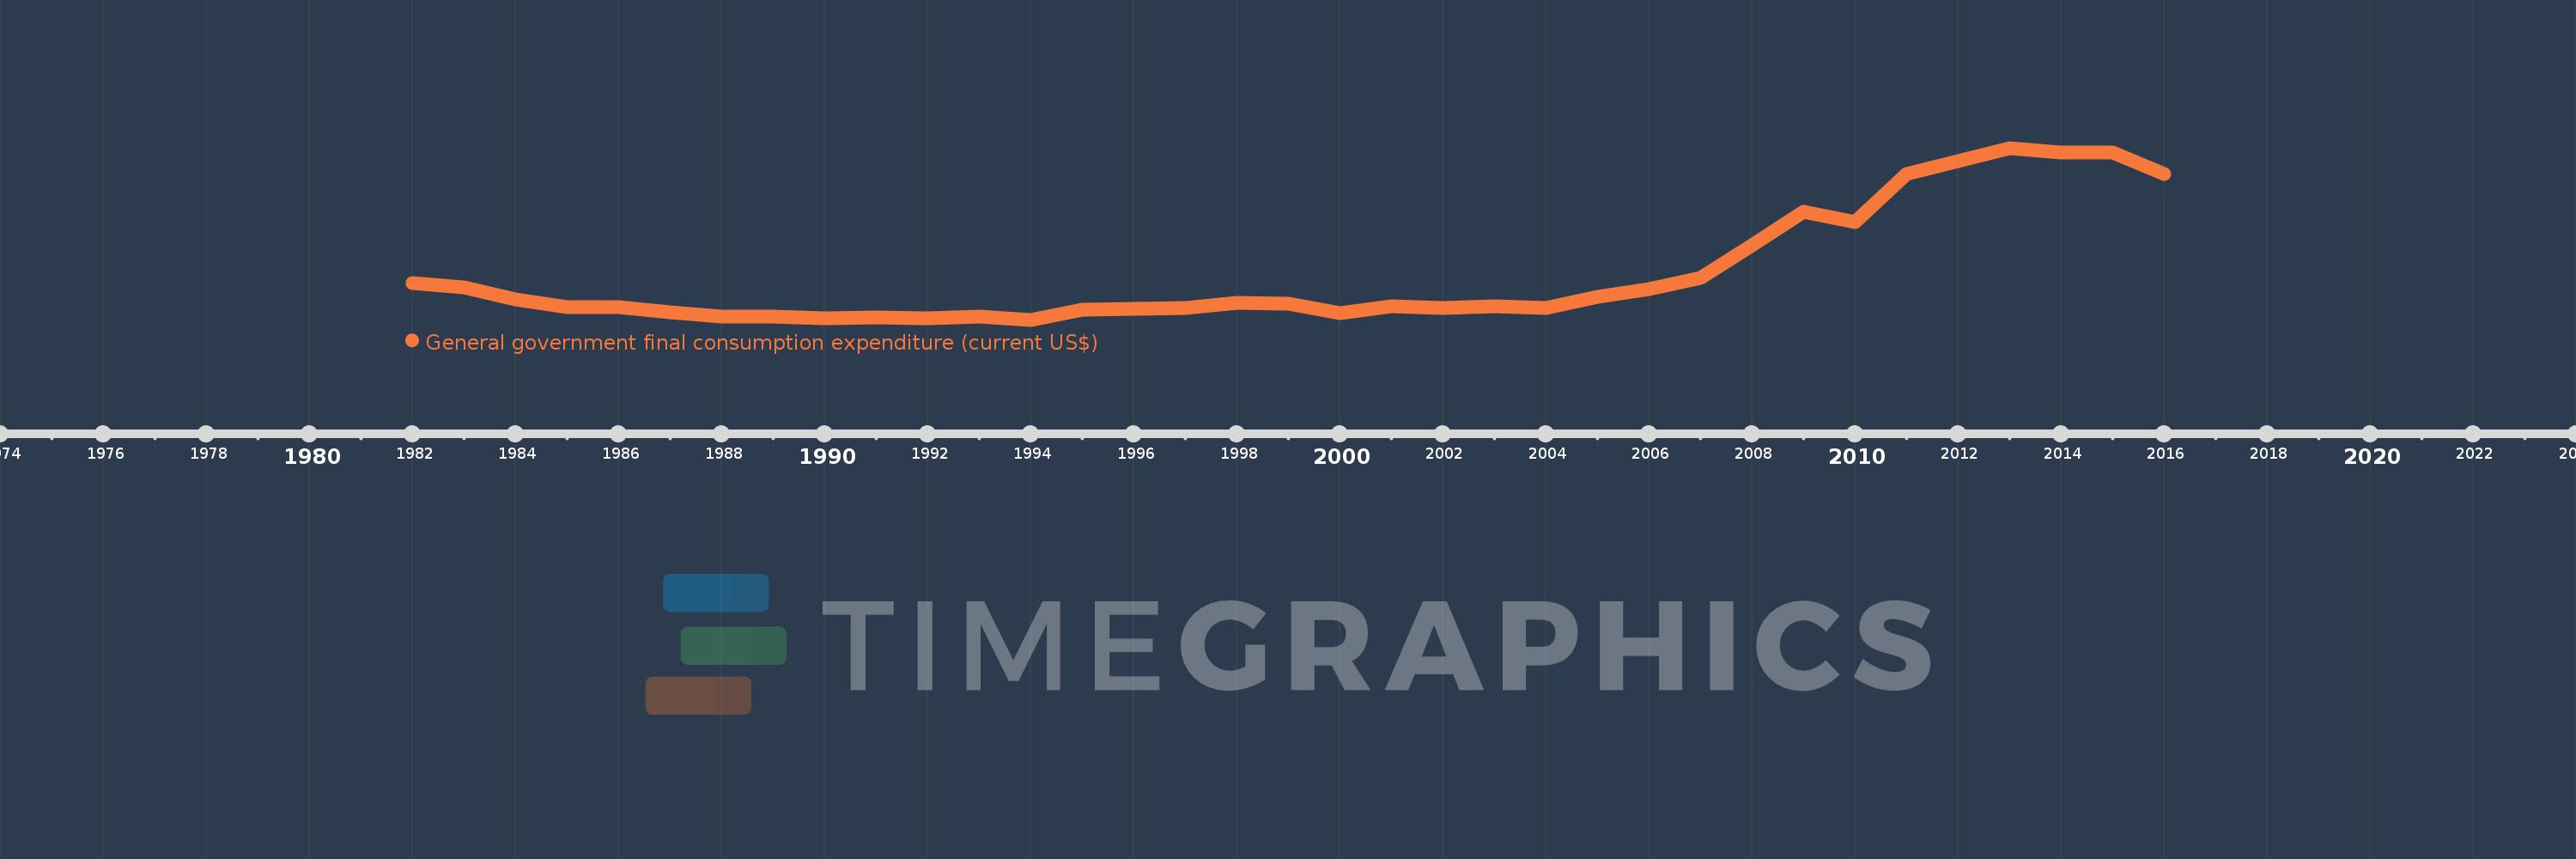
General government final consumption expenditure (current US$)
2016,2015,2014,2013,2012,2011,2010,2009,2008,2007,2006,2005,2004,2003,2002,2001,2000,1999,1998,1997,1996,1995,1994,1993,1992,1991,1990,1989,1988,1987,1986,1985,1984,1983,1982
This statistics in other country:
AfghanistanAlbaniaAlgeriaAngolaAntigua and BarbudaArab WorldArgentinaArmeniaArubaAustraliaAustriaAzerbaijanBahamas, TheBahrainBangladeshBarbadosBelarusBelgiumBelizeBeninBermudaBhutanBoliviaBosnia and HerzegovinaBotswanaBrazilBrunei DarussalamBulgariaBurkina FasoBurundiCabo VerdeCambodiaCameroonCanadaCaribbean small statesCentral African RepublicCentral Europe and the BalticsChadChileChinaColombiaComorosCongo, Dem. Rep.Congo, Rep.Costa RicaCote d'IvoireCroatiaCubaCyprusCzech RepublicDenmarkDjiboutiDominicaDominican RepublicEarly-demographic dividendEast Asia & PacificEast Asia & Pacific (excluding high income)East Asia & Pacific (IDA & IBRD countries)EcuadorEgypt, Arab Rep.El SalvadorEquatorial GuineaEritreaEstoniaEthiopiaEuro areaEurope & Central AsiaEurope & Central Asia (excluding high income)Europe & Central Asia (IDA & IBRD countries)European UnionFaroe IslandsFijiFinlandFragile and conflict affected situationsFranceFrench PolynesiaGabonGambia, TheGeorgiaGermanyGhanaGreeceGrenadaGuatemalaGuineaGuinea-BissauGuyanaHaitiHeavily indebted poor countries (HIPC)High incomeHondurasHong Kong SAR, ChinaHungaryIBRD onlyIcelandIDA & IBRD totalIDA blendIDA onlyIDA totalIndiaIndonesiaIran, Islamic Rep.IraqIrelandIsraelItalyJamaicaJapanJordanKazakhstanKenyaKiribatiKorea, Rep.KosovoKuwaitKyrgyz RepublicLao PDRLate-demographic dividendLatin America & Caribbean Latin America & Caribbean (excluding high income)Latin America & the Caribbean (IDA & IBRD countries)LatviaLeast developed countries: UN classificationLebanonLesothoLiberiaLibyaLithuaniaLow & middle incomeLow incomeLower middle incomeLuxembourgMacao SAR, ChinaMacedonia, FYRMadagascarMalawiMalaysiaMaldivesMaliMaltaMauritaniaMauritiusMexicoMicronesia, Fed. Sts.Middle East & North AfricaMiddle East & North Africa (excluding high income)Middle East & North Africa (IDA & IBRD countries)Middle incomeMoldovaMongoliaMontenegroMoroccoMozambiqueNamibiaNepalNetherlandsNew CaledoniaNew ZealandNicaraguaNigerNigeriaNorth AmericaNorwayOECD membersOmanOther small statesPakistanPanamaPapua New GuineaParaguayPeruPhilippinesPolandPortugalPost-demographic dividendPre-demographic dividendPuerto RicoQatarRomaniaRussian FederationRwandaSaudi ArabiaSenegalSerbiaSeychellesSierra LeoneSingaporeSlovak RepublicSloveniaSmall statesSolomon IslandsSomaliaSouth AfricaSouth AsiaSouth Asia (IDA & IBRD)South SudanSpainSri LankaSt. Kitts and NevisSt. LuciaSt. Vincent and the GrenadinesSub-Saharan Africa Sub-Saharan Africa (excluding high income)Sub-Saharan Africa (IDA & IBRD countries)SudanSurinameSwazilandSwedenSwitzerlandSyrian Arab RepublicTajikistanTanzaniaThailandTimor-LesteTogoTongaTrinidad and TobagoTunisiaTurkeyTurkmenistanUgandaUkraineUnited Arab EmiratesUnited KingdomUnited StatesUpper middle incomeUruguayUzbekistanVanuatuVenezuela, RBVietnamWest Bank and GazaWorldYemen, Rep.ZambiaZimbabwe Timeline:
This timeline shows a graph from 1982 to 2016 of Nigeria. No data until 1981. Number of actual observations by date: 35.
Source name:
World Development Indicators
Source organization:
World Bank national accounts data, and OECD National Accounts data files.
Categories, topics:
Economy & Growth
Last updated:
apr 23, 2017
Indicators value changes by year
Minimum:
1.033 bln
jan 1, 1994
Maximum:
37.798 bln
jan 1, 2013
At the date of observation
Value
Absolute change
Change from previous value
jan 1, 1982
8.954 bln
+8.954 bln
0.0%
jan 1, 1983
8.052 bln
-902.345 mln
-10.08%
jan 1, 1984
5.437 bln
-2.615 bln
-32.48%
jan 1, 1985
3.748 bln
-1.689 bln
-31.06%
jan 1, 1986
3.676 bln
-71.807 mln
-1.92%
jan 1, 1987
2.607 bln
-1.069 bln
-29.08%
jan 1, 1988
1.736 bln
-870.907 mln
-33.41%
jan 1, 1989
1.779 bln
+43.149 mln
2.49%
jan 1, 1990
1.32 bln
-459.428 mln
-25.82%
jan 1, 1991
1.527 bln
+207.051 mln
15.69%
jan 1, 1992
1.324 bln
-202.95 mln
-13.29%
jan 1, 1993
1.747 bln
+422.925 mln
31.94%
jan 1, 1994
1.033 bln
-713.857 mln
-40.86%
jan 1, 1995
3.245 bln
+2.212 bln
214.16%
jan 1, 1996
3.45 bln
+204.541 mln
6.3%
jan 1, 1997
3.505 bln
+54.87 mln
1.59%
jan 1, 1998
4.656 bln
+1.151 bln
32.84%
jan 1, 1999
4.472 bln
-183.764 mln
-3.95%
jan 1, 2000
2.505 bln
-1.967 bln
-43.99%
jan 1, 2001
3.87 bln
+1.365 bln
54.49%
jan 1, 2002
3.624 bln
-245.769 mln
-6.35%
jan 1, 2003
3.967 bln
+342.646 mln
9.45%
jan 1, 2004
3.486 bln
-480.504 mln
-12.11%
jan 1, 2005
5.913 bln
+2.427 bln
69.62%
jan 1, 2006
7.641 bln
+1.728 bln
29.22%
jan 1, 2007
9.976 bln
+2.335 bln
30.55%
jan 1, 2008
16.945 bln
+6.969 bln
69.86%
jan 1, 2009
24.222 bln
+7.277 bln
42.94%
jan 1, 2010
21.96 bln
-2.261 bln
-9.34%
jan 1, 2011
32.15 bln
+10.19 bln
46.4%
jan 1, 2012
34.975 bln
+2.824 bln
8.78%
jan 1, 2013
37.798 bln
+2.824 bln
8.07%
jan 1, 2014
36.847 bln
-951.483 mln
-2.52%
jan 1, 2015
36.751 bln
-96.428 mln
-0.26%
jan 1, 2016
32.174 bln
-4.576 bln
-12.45%
Ranking of countries by current statistics by years


Comments: