29
/
en
AIzaSyAYiBZKx7MnpbEhh9jyipgxe19OcubqV5w
April 1, 2024
38999
IDA only
IDX
false
2
1
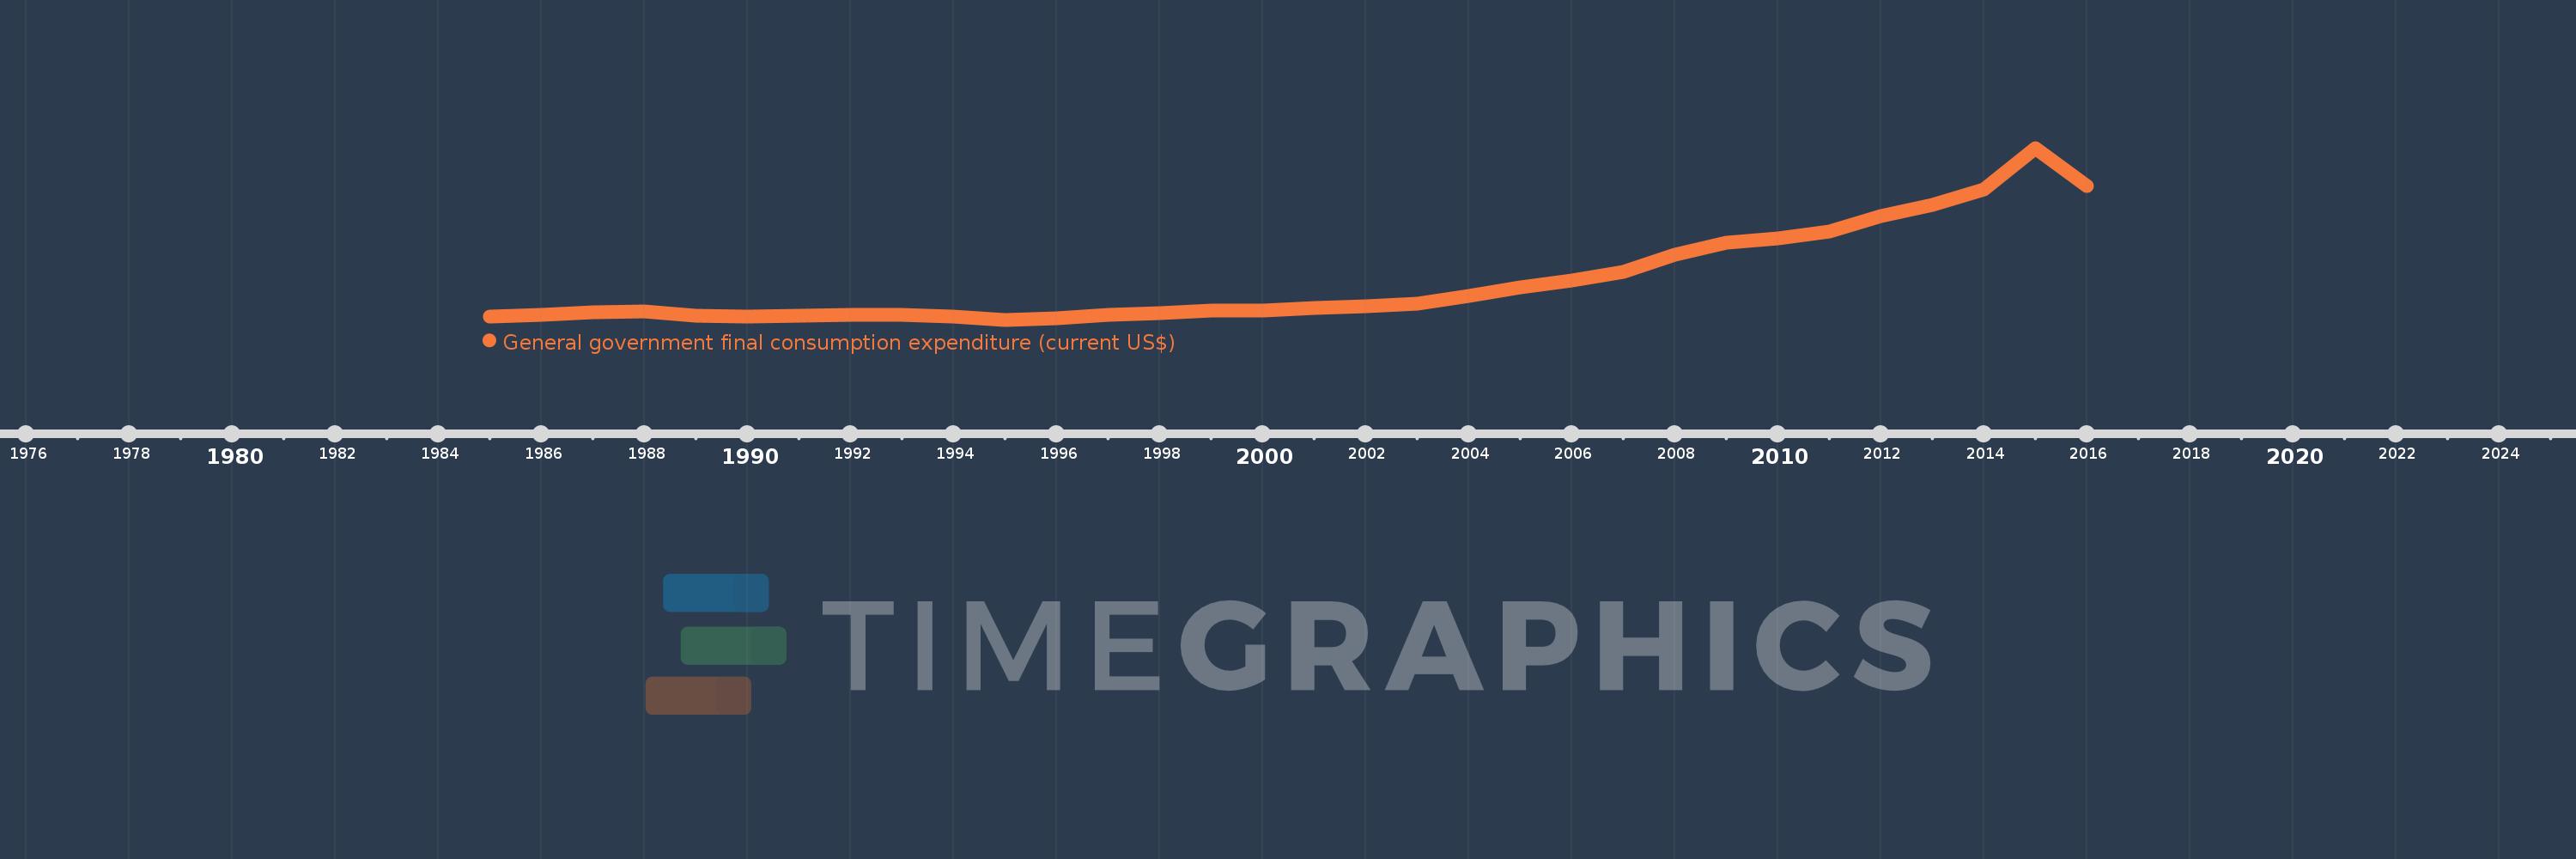
General government final consumption expenditure (current US$)
2016,2015,2014,2013,2012,2011,2010,2009,2008,2007,2006,2005,2004,2003,2002,2001,2000,1999,1998,1997,1996,1995,1994,1993,1992,1991,1990,1989,1988,1987,1986,1985
This statistics in other country:
AfghanistanAlbaniaAlgeriaAngolaAntigua and BarbudaArab WorldArgentinaArmeniaArubaAustraliaAustriaAzerbaijanBahamas, TheBahrainBangladeshBarbadosBelarusBelgiumBelizeBeninBermudaBhutanBoliviaBosnia and HerzegovinaBotswanaBrazilBrunei DarussalamBulgariaBurkina FasoBurundiCabo VerdeCambodiaCameroonCanadaCaribbean small statesCentral African RepublicCentral Europe and the BalticsChadChileChinaColombiaComorosCongo, Dem. Rep.Congo, Rep.Costa RicaCote d'IvoireCroatiaCubaCyprusCzech RepublicDenmarkDjiboutiDominicaDominican RepublicEarly-demographic dividendEast Asia & PacificEast Asia & Pacific (excluding high income)East Asia & Pacific (IDA & IBRD countries)EcuadorEgypt, Arab Rep.El SalvadorEquatorial GuineaEritreaEstoniaEthiopiaEuro areaEurope & Central AsiaEurope & Central Asia (excluding high income)Europe & Central Asia (IDA & IBRD countries)European UnionFaroe IslandsFijiFinlandFragile and conflict affected situationsFranceFrench PolynesiaGabonGambia, TheGeorgiaGermanyGhanaGreeceGrenadaGuatemalaGuineaGuinea-BissauGuyanaHaitiHeavily indebted poor countries (HIPC)High incomeHondurasHong Kong SAR, ChinaHungaryIBRD onlyIcelandIDA & IBRD totalIDA blendIDA onlyIDA totalIndiaIndonesiaIran, Islamic Rep.IraqIrelandIsraelItalyJamaicaJapanJordanKazakhstanKenyaKiribatiKorea, Rep.KosovoKuwaitKyrgyz RepublicLao PDRLate-demographic dividendLatin America & Caribbean Latin America & Caribbean (excluding high income)Latin America & the Caribbean (IDA & IBRD countries)LatviaLeast developed countries: UN classificationLebanonLesothoLiberiaLibyaLithuaniaLow & middle incomeLow incomeLower middle incomeLuxembourgMacao SAR, ChinaMacedonia, FYRMadagascarMalawiMalaysiaMaldivesMaliMaltaMauritaniaMauritiusMexicoMicronesia, Fed. Sts.Middle East & North AfricaMiddle East & North Africa (excluding high income)Middle East & North Africa (IDA & IBRD countries)Middle incomeMoldovaMongoliaMontenegroMoroccoMozambiqueNamibiaNepalNetherlandsNew CaledoniaNew ZealandNicaraguaNigerNigeriaNorth AmericaNorwayOECD membersOmanOther small statesPakistanPanamaPapua New GuineaParaguayPeruPhilippinesPolandPortugalPost-demographic dividendPre-demographic dividendPuerto RicoQatarRomaniaRussian FederationRwandaSaudi ArabiaSenegalSerbiaSeychellesSierra LeoneSingaporeSlovak RepublicSloveniaSmall statesSolomon IslandsSomaliaSouth AfricaSouth AsiaSouth Asia (IDA & IBRD)South SudanSpainSri LankaSt. Kitts and NevisSt. LuciaSt. Vincent and the GrenadinesSub-Saharan Africa Sub-Saharan Africa (excluding high income)Sub-Saharan Africa (IDA & IBRD countries)SudanSurinameSwazilandSwedenSwitzerlandSyrian Arab RepublicTajikistanTanzaniaThailandTimor-LesteTogoTongaTrinidad and TobagoTunisiaTurkeyTurkmenistanUgandaUkraineUnited Arab EmiratesUnited KingdomUnited StatesUpper middle incomeUruguayUzbekistanVanuatuVenezuela, RBVietnamWest Bank and GazaWorldYemen, Rep.ZambiaZimbabwe Timeline:
This timeline shows a graph from 1985 to 2016 of IDA only. No data until 1984. Number of actual observations by date: 32.
Source name:
World Development Indicators
Source organization:
World Bank national accounts data, and OECD National Accounts data files.
Categories, topics:
Economy & Growth
Last updated:
apr 23, 2017
Indicators value changes by year
Minimum:
19.729 bln
jan 1, 1995
Maximum:
154.066 bln
jan 1, 2015
At the date of observation
Value
Absolute change
Change from previous value
jan 1, 1985
22.195 bln
+22.195 bln
0.0%
jan 1, 1986
23.293 bln
+1.099 bln
4.95%
jan 1, 1987
25.325 bln
+2.032 bln
8.72%
jan 1, 1988
26.07 bln
+744.298 mln
2.94%
jan 1, 1989
22.682 bln
-3.387 bln
-12.99%
jan 1, 1990
21.939 bln
-743.778 mln
-3.28%
jan 1, 1991
23.176 bln
+1.237 bln
5.64%
jan 1, 1992
23.481 bln
+305.688 mln
1.32%
jan 1, 1993
23.835 bln
+353.628 mln
1.51%
jan 1, 1994
22.216 bln
-1.619 bln
-6.79%
jan 1, 1995
19.729 bln
-2.487 bln
-11.19%
jan 1, 1996
21.03 bln
+1.301 bln
6.6%
jan 1, 1997
23.449 bln
+2.419 bln
11.5%
jan 1, 1998
25.028 bln
+1.579 bln
6.73%
jan 1, 1999
27.044 bln
+2.016 bln
8.06%
jan 1, 2000
27.203 bln
+158.308 mln
0.59%
jan 1, 2001
28.703 bln
+1.5 bln
5.51%
jan 1, 2002
30.359 bln
+1.656 bln
5.77%
jan 1, 2003
32.566 bln
+2.207 bln
7.27%
jan 1, 2004
38.161 bln
+5.595 bln
17.18%
jan 1, 2005
44.83 bln
+6.669 bln
17.48%
jan 1, 2006
50.61 bln
+5.78 bln
12.89%
jan 1, 2007
57.477 bln
+6.867 bln
13.57%
jan 1, 2008
70.388 bln
+12.911 bln
22.46%
jan 1, 2009
79.69 bln
+9.302 bln
13.21%
jan 1, 2010
83.439 bln
+3.749 bln
4.7%
jan 1, 2011
88.484 bln
+5.045 bln
6.05%
jan 1, 2012
100.685 bln
+12.202 bln
13.79%
jan 1, 2013
109.227 bln
+8.542 bln
8.48%
jan 1, 2014
121.373 bln
+12.146 bln
11.12%
jan 1, 2015
154.066 bln
+32.693 bln
26.94%
jan 1, 2016
124.389 bln
-29.677 bln
-19.26%
Ranking of countries by current statistics by years


Comments: