29
/
en
AIzaSyAYiBZKx7MnpbEhh9jyipgxe19OcubqV5w
April 1, 2024
107261
Colombia
COL
true
2
1
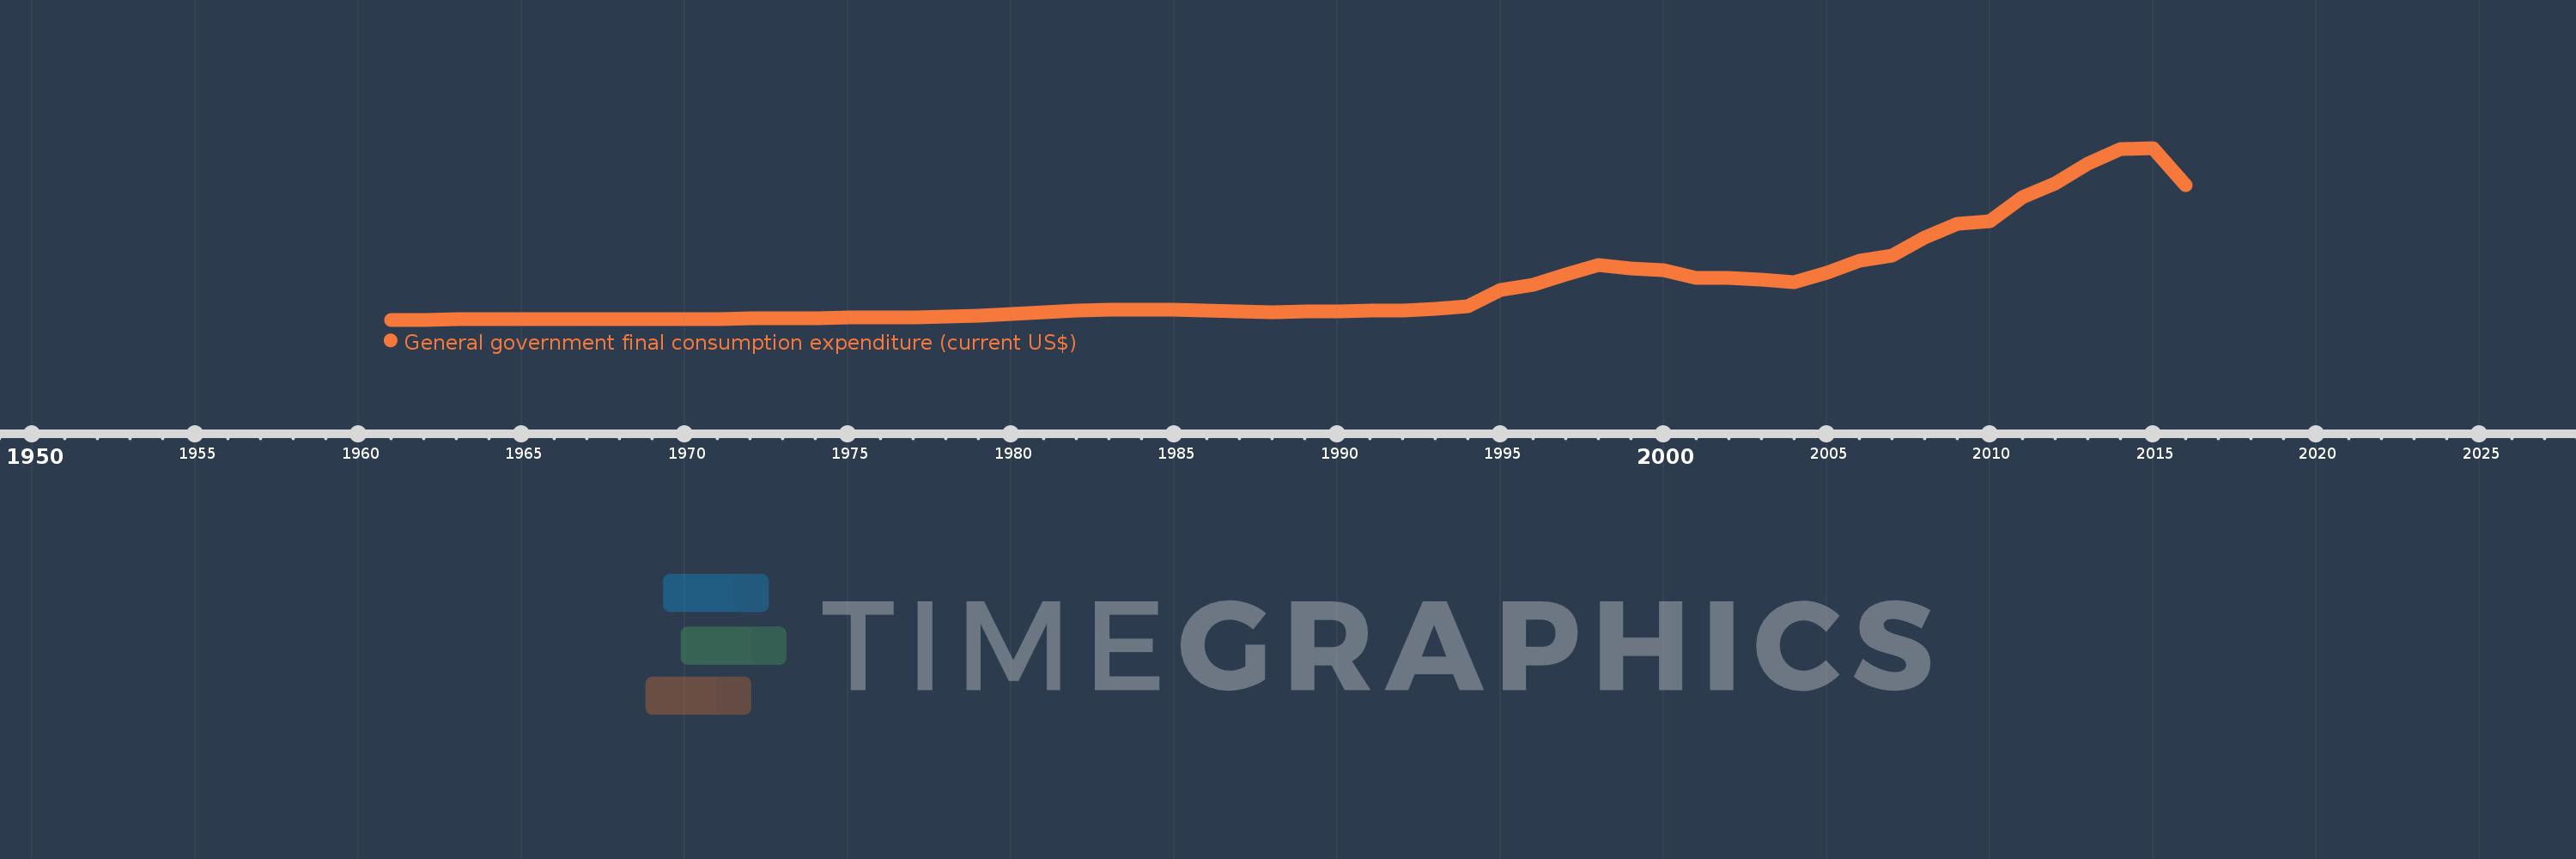
General government final consumption expenditure (current US$)
2016,2015,2014,2013,2012,2011,2010,2009,2008,2007,2006,2005,2004,2003,2002,2001,2000,1999,1998,1997,1996,1995,1994,1993,1992,1991,1990,1989,1988,1987,1986,1985,1984,1983,1982,1981,1980,1979,1978,1977,1976,1975,1974,1973,1972,1971,1970,1969,1968,1967,1966,1965,1964,1963,1962,1961
This statistics in other country:
AfghanistanAlbaniaAlgeriaAngolaAntigua and BarbudaArab WorldArgentinaArmeniaArubaAustraliaAustriaAzerbaijanBahamas, TheBahrainBangladeshBarbadosBelarusBelgiumBelizeBeninBermudaBhutanBoliviaBosnia and HerzegovinaBotswanaBrazilBrunei DarussalamBulgariaBurkina FasoBurundiCabo VerdeCambodiaCameroonCanadaCaribbean small statesCentral African RepublicCentral Europe and the BalticsChadChileChinaColombiaComorosCongo, Dem. Rep.Congo, Rep.Costa RicaCote d'IvoireCroatiaCubaCyprusCzech RepublicDenmarkDjiboutiDominicaDominican RepublicEarly-demographic dividendEast Asia & PacificEast Asia & Pacific (excluding high income)East Asia & Pacific (IDA & IBRD countries)EcuadorEgypt, Arab Rep.El SalvadorEquatorial GuineaEritreaEstoniaEthiopiaEuro areaEurope & Central AsiaEurope & Central Asia (excluding high income)Europe & Central Asia (IDA & IBRD countries)European UnionFaroe IslandsFijiFinlandFragile and conflict affected situationsFranceFrench PolynesiaGabonGambia, TheGeorgiaGermanyGhanaGreeceGrenadaGuatemalaGuineaGuinea-BissauGuyanaHaitiHeavily indebted poor countries (HIPC)High incomeHondurasHong Kong SAR, ChinaHungaryIBRD onlyIcelandIDA & IBRD totalIDA blendIDA onlyIDA totalIndiaIndonesiaIran, Islamic Rep.IraqIrelandIsraelItalyJamaicaJapanJordanKazakhstanKenyaKiribatiKorea, Rep.KosovoKuwaitKyrgyz RepublicLao PDRLate-demographic dividendLatin America & Caribbean Latin America & Caribbean (excluding high income)Latin America & the Caribbean (IDA & IBRD countries)LatviaLeast developed countries: UN classificationLebanonLesothoLiberiaLibyaLithuaniaLow & middle incomeLow incomeLower middle incomeLuxembourgMacao SAR, ChinaMacedonia, FYRMadagascarMalawiMalaysiaMaldivesMaliMaltaMauritaniaMauritiusMexicoMicronesia, Fed. Sts.Middle East & North AfricaMiddle East & North Africa (excluding high income)Middle East & North Africa (IDA & IBRD countries)Middle incomeMoldovaMongoliaMontenegroMoroccoMozambiqueNamibiaNepalNetherlandsNew CaledoniaNew ZealandNicaraguaNigerNigeriaNorth AmericaNorwayOECD membersOmanOther small statesPakistanPanamaPapua New GuineaParaguayPeruPhilippinesPolandPortugalPost-demographic dividendPre-demographic dividendPuerto RicoQatarRomaniaRussian FederationRwandaSaudi ArabiaSenegalSerbiaSeychellesSierra LeoneSingaporeSlovak RepublicSloveniaSmall statesSolomon IslandsSomaliaSouth AfricaSouth AsiaSouth Asia (IDA & IBRD)South SudanSpainSri LankaSt. Kitts and NevisSt. LuciaSt. Vincent and the GrenadinesSub-Saharan Africa Sub-Saharan Africa (excluding high income)Sub-Saharan Africa (IDA & IBRD countries)SudanSurinameSwazilandSwedenSwitzerlandSyrian Arab RepublicTajikistanTanzaniaThailandTimor-LesteTogoTongaTrinidad and TobagoTunisiaTurkeyTurkmenistanUgandaUkraineUnited Arab EmiratesUnited KingdomUnited StatesUpper middle incomeUruguayUzbekistanVanuatuVenezuela, RBVietnamWest Bank and GazaWorldYemen, Rep.ZambiaZimbabwe Timeline:
This timeline shows a graph from 1961 to 2016 of Colombia. No data until 1960. Number of actual observations by date: 56.
Source name:
World Development Indicators
Source organization:
World Bank national accounts data, and OECD National Accounts data files.
Categories, topics:
Economy & Growth
Last updated:
apr 23, 2017
Indicators value changes by year
Minimum:
257.038 mln
jan 1, 1961
Maximum:
67.856 bln
jan 1, 2015
At the date of observation
Value
Absolute change
Change from previous value
jan 1, 1961
257.038 mln
+257.038 mln
0.0%
jan 1, 1962
307.9 mln
+50.862 mln
19.79%
jan 1, 1963
349.23 mln
+41.33 mln
13.42%
jan 1, 1964
358.564 mln
+9.335 mln
2.67%
jan 1, 1965
397.148 mln
+38.584 mln
10.76%
jan 1, 1966
376.6 mln
-20.548 mln
-5.17%
jan 1, 1967
363.733 mln
-12.867 mln
-3.42%
jan 1, 1968
394.08 mln
+30.347 mln
8.34%
jan 1, 1969
403.874 mln
+9.794 mln
2.49%
jan 1, 1970
452.196 mln
+48.321 mln
11.96%
jan 1, 1971
650.611 mln
+198.415 mln
43.88%
jan 1, 1972
852.844 mln
+202.233 mln
31.08%
jan 1, 1973
823.169 mln
-29.675 mln
-3.48%
jan 1, 1974
975.746 mln
+152.577 mln
18.54%
jan 1, 1975
1.074 bln
+98.627 mln
10.11%
jan 1, 1976
1.164 bln
+89.639 mln
8.34%
jan 1, 1977
1.268 bln
+104.182 mln
8.95%
jan 1, 1978
1.496 bln
+227.419 mln
17.93%
jan 1, 1979
1.995 bln
+499.526 mln
33.4%
jan 1, 1980
2.609 bln
+613.66 mln
30.76%
jan 1, 1981
3.363 bln
+754.265 mln
28.91%
jan 1, 1982
3.799 bln
+435.853 mln
12.96%
jan 1, 1983
4.26 bln
+460.996 mln
12.13%
jan 1, 1984
4.248 bln
-11.745 mln
-0.28%
jan 1, 1985
4.225 bln
-22.713 mln
-0.53%
jan 1, 1986
3.731 bln
-494.211 mln
-11.7%
jan 1, 1987
3.427 bln
-303.823 mln
-8.14%
jan 1, 1988
3.166 bln
-261.806 mln
-7.64%
jan 1, 1989
3.386 bln
+220.38 mln
6.96%
jan 1, 1990
3.649 bln
+263.04 mln
7.77%
jan 1, 1991
3.783 bln
+133.864 mln
3.67%
jan 1, 1992
3.813 bln
+30.383 mln
0.8%
jan 1, 1993
4.705 bln
+891.906 mln
23.39%
jan 1, 1994
5.624 bln
+918.517 mln
19.52%
jan 1, 1995
12.023 bln
+6.4 bln
113.8%
jan 1, 1996
14.095 bln
+2.072 bln
17.23%
jan 1, 1997
17.94 bln
+3.845 bln
27.28%
jan 1, 1998
21.771 bln
+3.83 bln
21.35%
jan 1, 1999
20.512 bln
-1.259 bln
-5.78%
jan 1, 2000
19.594 bln
-917.896 mln
-4.47%
jan 1, 2001
16.772 bln
-2.822 bln
-14.4%
jan 1, 2002
16.583 bln
-189.18 mln
-1.13%
jan 1, 2003
16.034 bln
-548.622 mln
-3.31%
jan 1, 2004
15.081 bln
-952.62 mln
-5.94%
jan 1, 2005
18.719 bln
+3.637 bln
24.12%
jan 1, 2006
23.454 bln
+4.736 bln
25.3%
jan 1, 2007
25.53 bln
+2.076 bln
8.85%
jan 1, 2008
32.443 bln
+6.912 bln
27.08%
jan 1, 2009
37.86 bln
+5.418 bln
16.7%
jan 1, 2010
39.059 bln
+1.199 bln
3.17%
jan 1, 2011
48.588 bln
+9.528 bln
24.39%
jan 1, 2012
53.985 bln
+5.397 bln
11.11%
jan 1, 2013
61.647 bln
+7.662 bln
14.19%
jan 1, 2014
67.28 bln
+5.633 bln
9.14%
jan 1, 2015
67.856 bln
+575.508 mln
0.86%
jan 1, 2016
53.282 bln
-14.574 bln
-21.48%
Ranking of countries by current statistics by years


Comments: