29
/
en
AIzaSyAYiBZKx7MnpbEhh9jyipgxe19OcubqV5w
April 1, 2024
103620
Chad
TCD
true
2
1
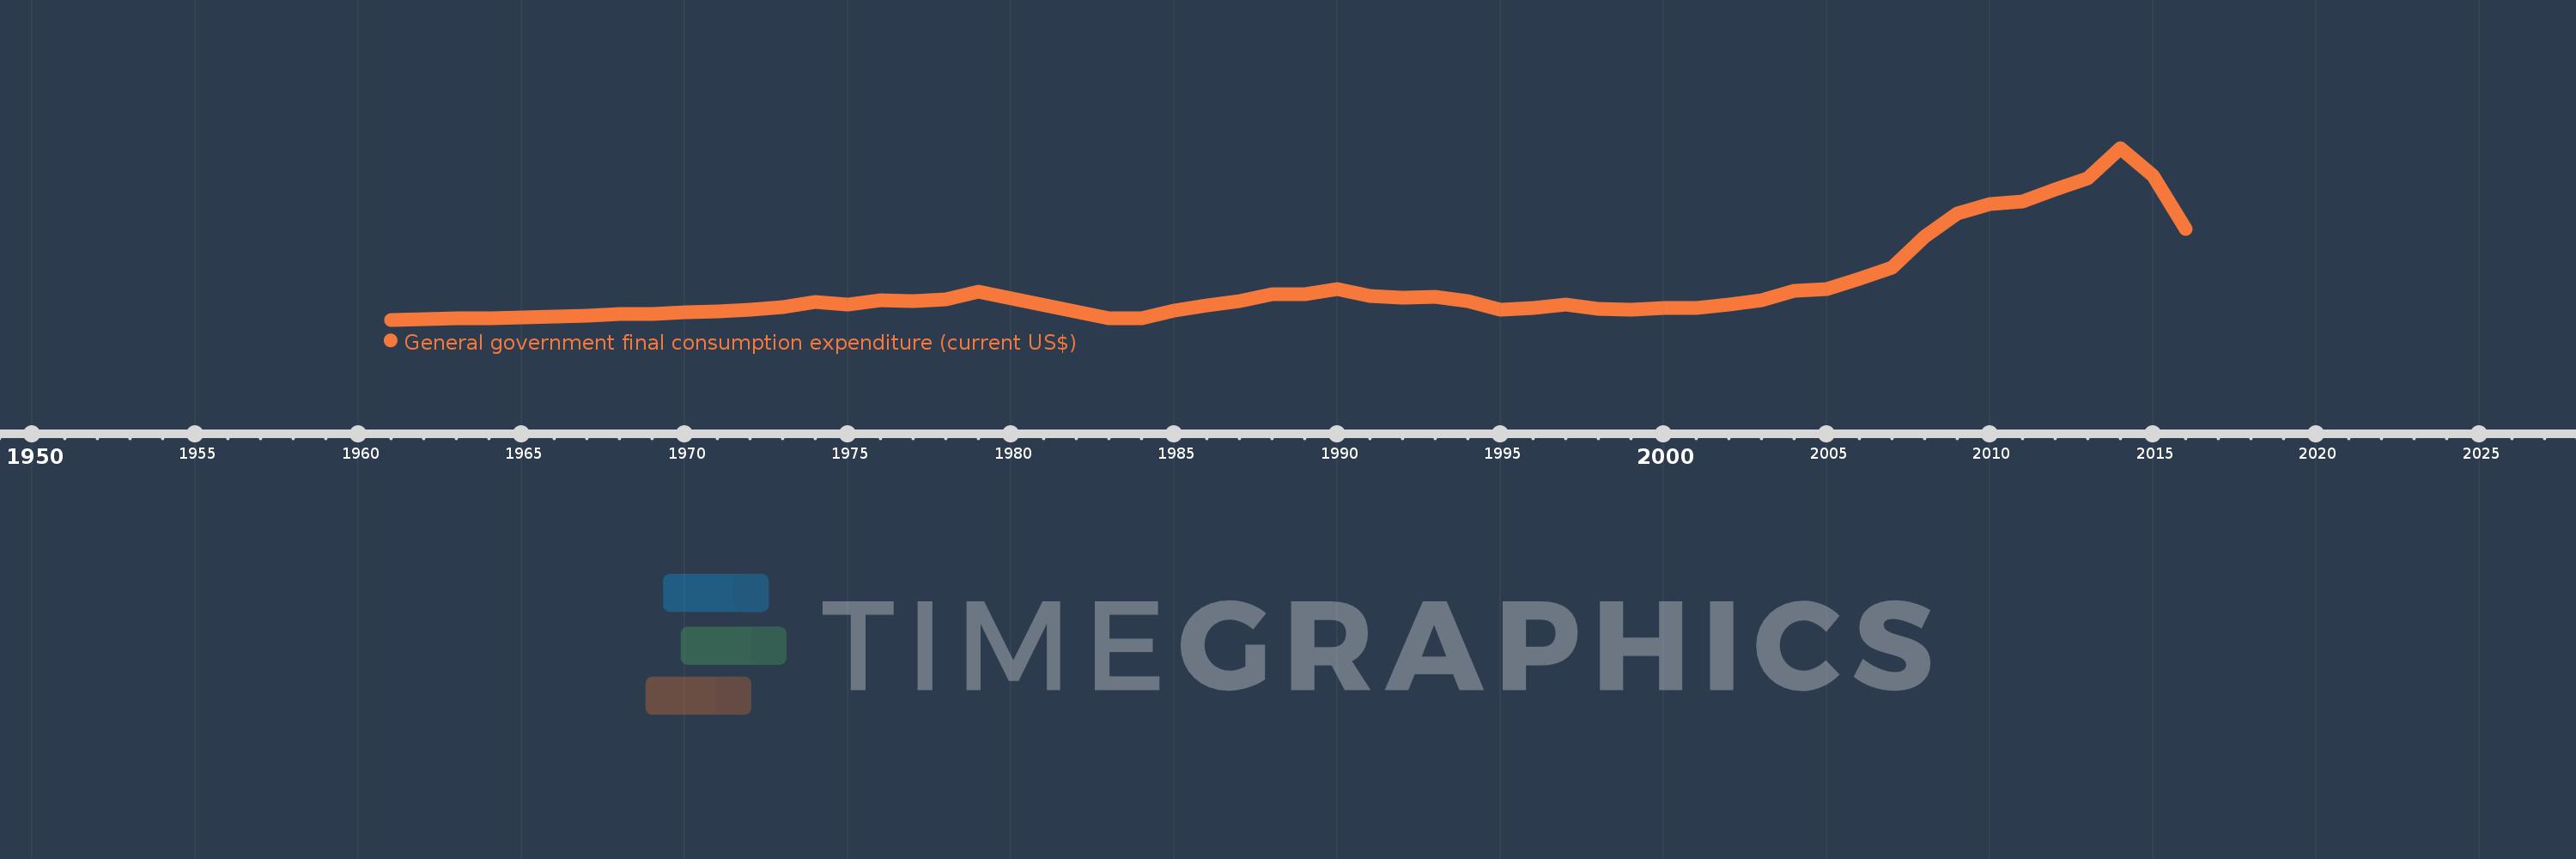
General government final consumption expenditure (current US$)
2016,2015,2014,2013,2012,2011,2010,2009,2008,2007,2006,2005,2004,2003,2002,2001,2000,1999,1998,1997,1996,1995,1994,1993,1992,1991,1990,1989,1988,1987,1986,1985,1984,1983,1979,1978,1977,1976,1975,1974,1973,1972,1971,1970,1969,1968,1967,1966,1965,1964,1963,1962,1961
This statistics in other country:
AfghanistanAlbaniaAlgeriaAngolaAntigua and BarbudaArab WorldArgentinaArmeniaArubaAustraliaAustriaAzerbaijanBahamas, TheBahrainBangladeshBarbadosBelarusBelgiumBelizeBeninBermudaBhutanBoliviaBosnia and HerzegovinaBotswanaBrazilBrunei DarussalamBulgariaBurkina FasoBurundiCabo VerdeCambodiaCameroonCanadaCaribbean small statesCentral African RepublicCentral Europe and the BalticsChadChileChinaColombiaComorosCongo, Dem. Rep.Congo, Rep.Costa RicaCote d'IvoireCroatiaCubaCyprusCzech RepublicDenmarkDjiboutiDominicaDominican RepublicEarly-demographic dividendEast Asia & PacificEast Asia & Pacific (excluding high income)East Asia & Pacific (IDA & IBRD countries)EcuadorEgypt, Arab Rep.El SalvadorEquatorial GuineaEritreaEstoniaEthiopiaEuro areaEurope & Central AsiaEurope & Central Asia (excluding high income)Europe & Central Asia (IDA & IBRD countries)European UnionFaroe IslandsFijiFinlandFragile and conflict affected situationsFranceFrench PolynesiaGabonGambia, TheGeorgiaGermanyGhanaGreeceGrenadaGuatemalaGuineaGuinea-BissauGuyanaHaitiHeavily indebted poor countries (HIPC)High incomeHondurasHong Kong SAR, ChinaHungaryIBRD onlyIcelandIDA & IBRD totalIDA blendIDA onlyIDA totalIndiaIndonesiaIran, Islamic Rep.IraqIrelandIsraelItalyJamaicaJapanJordanKazakhstanKenyaKiribatiKorea, Rep.KosovoKuwaitKyrgyz RepublicLao PDRLate-demographic dividendLatin America & Caribbean Latin America & Caribbean (excluding high income)Latin America & the Caribbean (IDA & IBRD countries)LatviaLeast developed countries: UN classificationLebanonLesothoLiberiaLibyaLithuaniaLow & middle incomeLow incomeLower middle incomeLuxembourgMacao SAR, ChinaMacedonia, FYRMadagascarMalawiMalaysiaMaldivesMaliMaltaMauritaniaMauritiusMexicoMicronesia, Fed. Sts.Middle East & North AfricaMiddle East & North Africa (excluding high income)Middle East & North Africa (IDA & IBRD countries)Middle incomeMoldovaMongoliaMontenegroMoroccoMozambiqueNamibiaNepalNetherlandsNew CaledoniaNew ZealandNicaraguaNigerNigeriaNorth AmericaNorwayOECD membersOmanOther small statesPakistanPanamaPapua New GuineaParaguayPeruPhilippinesPolandPortugalPost-demographic dividendPre-demographic dividendPuerto RicoQatarRomaniaRussian FederationRwandaSaudi ArabiaSenegalSerbiaSeychellesSierra LeoneSingaporeSlovak RepublicSloveniaSmall statesSolomon IslandsSomaliaSouth AfricaSouth AsiaSouth Asia (IDA & IBRD)South SudanSpainSri LankaSt. Kitts and NevisSt. LuciaSt. Vincent and the GrenadinesSub-Saharan Africa Sub-Saharan Africa (excluding high income)Sub-Saharan Africa (IDA & IBRD countries)SudanSurinameSwazilandSwedenSwitzerlandSyrian Arab RepublicTajikistanTanzaniaThailandTimor-LesteTogoTongaTrinidad and TobagoTunisiaTurkeyTurkmenistanUgandaUkraineUnited Arab EmiratesUnited KingdomUnited StatesUpper middle incomeUruguayUzbekistanVanuatuVenezuela, RBVietnamWest Bank and GazaWorldYemen, Rep.ZambiaZimbabwe Timeline:
This timeline shows a graph from 1961 to 2016 of Chad. No data until 1960. Number of actual observations by date: 53.
Source name:
World Development Indicators
Source organization:
World Bank national accounts data, and OECD National Accounts data files.
Categories, topics:
Economy & Growth
Last updated:
apr 23, 2017
Indicators value changes by year
Minimum:
39.591 mln
jan 1, 1961
Maximum:
1.026 bln
jan 1, 2014
At the date of observation
Value
Absolute change
Change from previous value
jan 1, 1961
39.591 mln
+39.591 mln
0.0%
jan 1, 1962
42.31 mln
+2.719 mln
6.87%
jan 1, 1963
47.134 mln
+4.824 mln
11.4%
jan 1, 1964
49.866 mln
+2.732 mln
5.8%
jan 1, 1965
53.279 mln
+3.413 mln
6.84%
jan 1, 1966
57.37 mln
+4.09 mln
7.68%
jan 1, 1967
63.357 mln
+5.987 mln
10.44%
jan 1, 1968
70.758 mln
+7.401 mln
11.68%
jan 1, 1969
74.367 mln
+3.609 mln
5.1%
jan 1, 1970
83.698 mln
+9.33 mln
12.55%
jan 1, 1971
87.801 mln
+4.104 mln
4.9%
jan 1, 1972
96.645 mln
+8.843 mln
10.07%
jan 1, 1973
114.224 mln
+17.579 mln
18.19%
jan 1, 1974
140.42 mln
+26.196 mln
22.93%
jan 1, 1975
126.549 mln
-13.871 mln
-9.88%
jan 1, 1976
153.849 mln
+27.3 mln
21.57%
jan 1, 1977
144.29 mln
-9.559 mln
-6.21%
jan 1, 1978
158.051 mln
+13.761 mln
9.54%
jan 1, 1979
198.931 mln
+40.88 mln
25.86%
jan 1, 1983
45.647 mln
-153.284 mln
-77.05%
jan 1, 1984
50.364 mln
+4.717 mln
10.33%
jan 1, 1985
92.062 mln
+41.698 mln
82.79%
jan 1, 1986
121.343 mln
+29.281 mln
31.81%
jan 1, 1987
148.496 mln
+27.153 mln
22.38%
jan 1, 1988
184.121 mln
+35.625 mln
23.99%
jan 1, 1989
188.391 mln
+4.271 mln
2.32%
jan 1, 1990
215.706 mln
+27.315 mln
14.5%
jan 1, 1991
174.661 mln
-41.045 mln
-19.03%
jan 1, 1992
167.317 mln
-7.343 mln
-4.2%
jan 1, 1993
173.096 mln
+5.778 mln
3.45%
jan 1, 1994
147.017 mln
-26.079 mln
-15.07%
jan 1, 1995
95.28 mln
-51.737 mln
-35.19%
jan 1, 1996
105.099 mln
+9.819 mln
10.31%
jan 1, 1997
126.909 mln
+21.81 mln
20.75%
jan 1, 1998
100.827 mln
-26.083 mln
-20.55%
jan 1, 1999
98.206 mln
-2.62 mln
-2.6%
jan 1, 2000
106.296 mln
+8.09 mln
8.24%
jan 1, 2001
106.902 mln
+606.145K
0.57%
jan 1, 2002
128.029 mln
+21.127 mln
19.76%
jan 1, 2003
153.154 mln
+25.124 mln
19.62%
jan 1, 2004
207.656 mln
+54.502 mln
35.59%
jan 1, 2005
216.711 mln
+9.055 mln
4.36%
jan 1, 2006
276.329 mln
+59.618 mln
27.51%
jan 1, 2007
339.431 mln
+63.102 mln
22.84%
jan 1, 2008
518.293 mln
+178.862 mln
52.69%
jan 1, 2009
648.732 mln
+130.439 mln
25.17%
jan 1, 2010
702.628 mln
+53.896 mln
8.31%
jan 1, 2011
717.828 mln
+15.199 mln
2.16%
jan 1, 2012
788.196 mln
+70.369 mln
9.8%
jan 1, 2013
850.447 mln
+62.25 mln
7.9%
jan 1, 2014
1.026 bln
+175.72 mln
20.66%
jan 1, 2015
866.774 mln
-159.393 mln
-15.53%
jan 1, 2016
563.181 mln
-303.593 mln
-35.03%
Ranking of countries by current statistics by years


Comments: