29
/
en
AIzaSyAYiBZKx7MnpbEhh9jyipgxe19OcubqV5w
April 1, 2024
64725
Albania
ALB
true
2
1
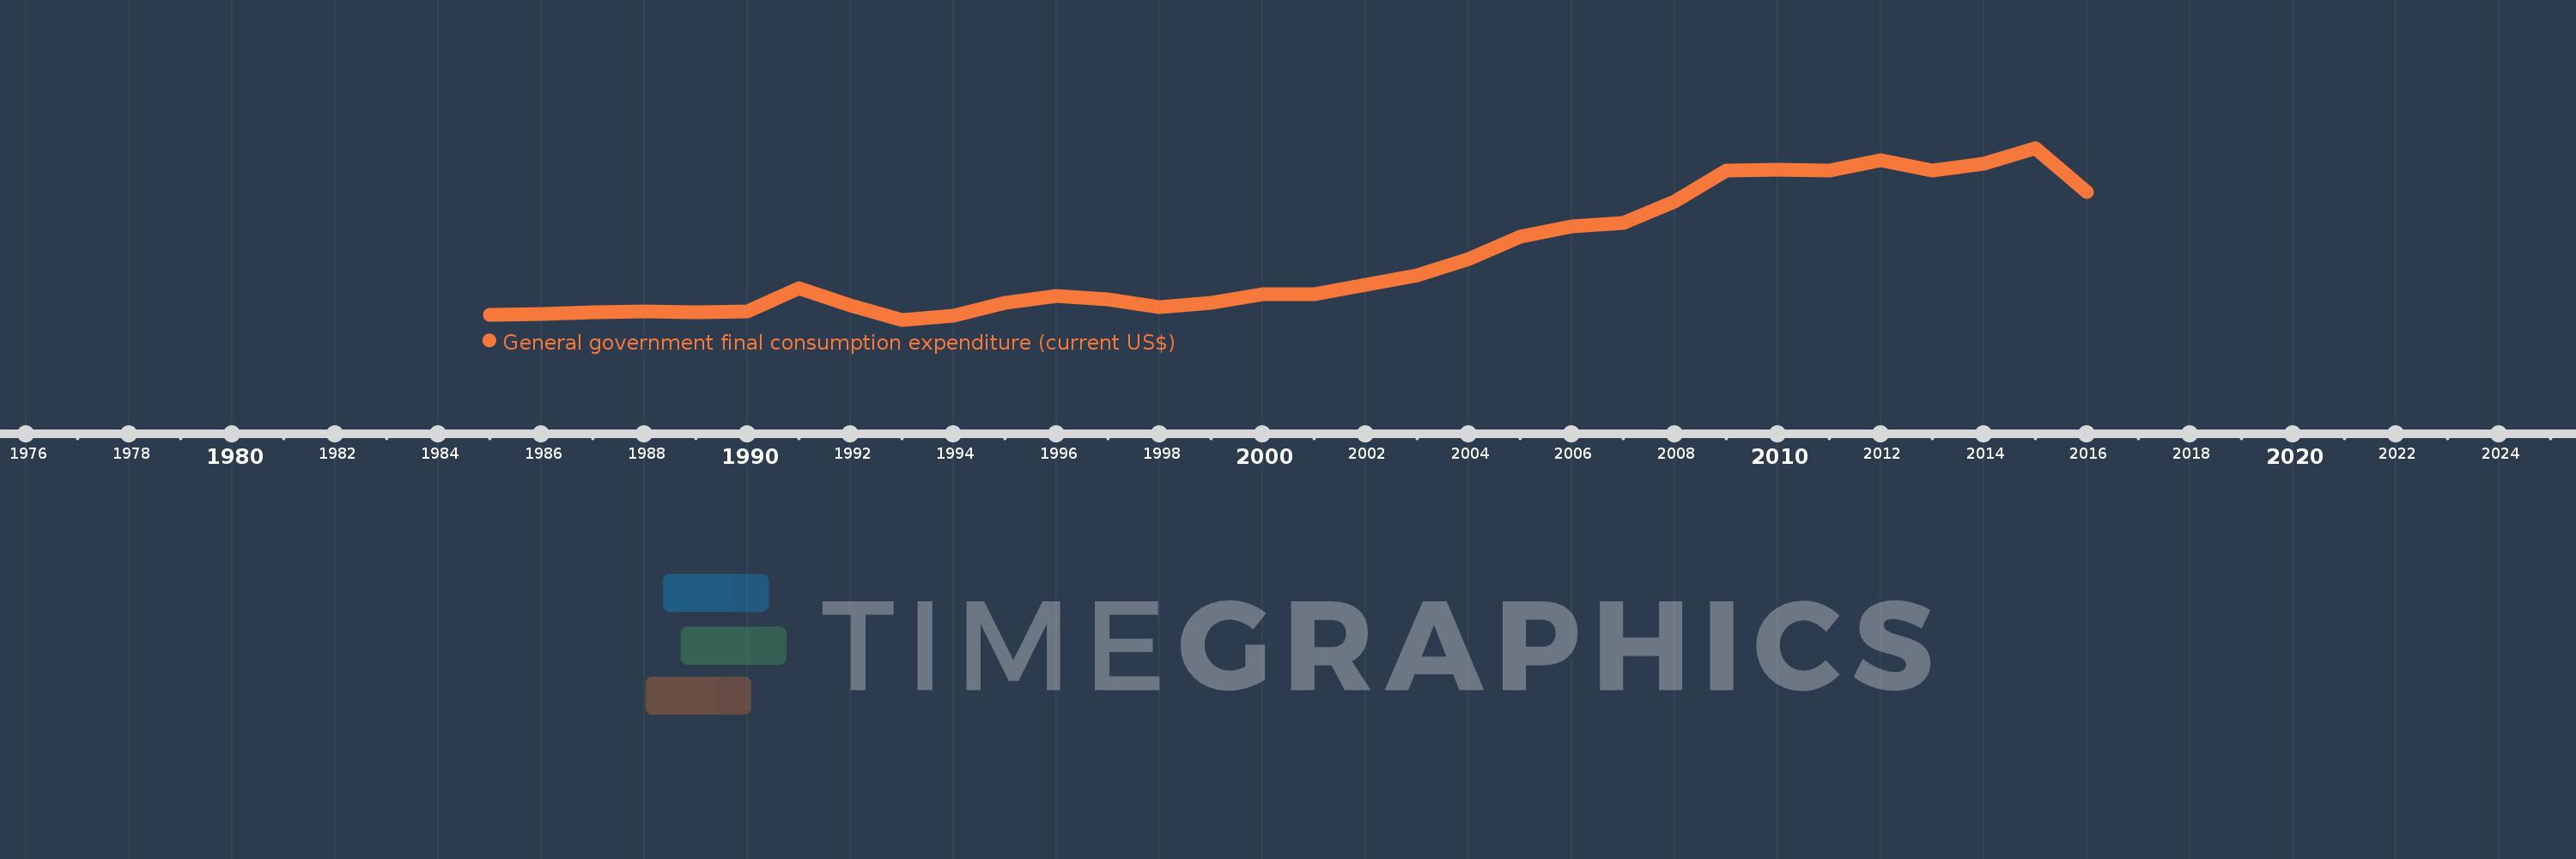
General government final consumption expenditure (current US$)
2016,2015,2014,2013,2012,2011,2010,2009,2008,2007,2006,2005,2004,2003,2002,2001,2000,1999,1998,1997,1996,1995,1994,1993,1992,1991,1990,1989,1988,1987,1986,1985
This statistics in other country:
AfghanistanAlbaniaAlgeriaAngolaAntigua and BarbudaArab WorldArgentinaArmeniaArubaAustraliaAustriaAzerbaijanBahamas, TheBahrainBangladeshBarbadosBelarusBelgiumBelizeBeninBermudaBhutanBoliviaBosnia and HerzegovinaBotswanaBrazilBrunei DarussalamBulgariaBurkina FasoBurundiCabo VerdeCambodiaCameroonCanadaCaribbean small statesCentral African RepublicCentral Europe and the BalticsChadChileChinaColombiaComorosCongo, Dem. Rep.Congo, Rep.Costa RicaCote d'IvoireCroatiaCubaCyprusCzech RepublicDenmarkDjiboutiDominicaDominican RepublicEarly-demographic dividendEast Asia & PacificEast Asia & Pacific (excluding high income)East Asia & Pacific (IDA & IBRD countries)EcuadorEgypt, Arab Rep.El SalvadorEquatorial GuineaEritreaEstoniaEthiopiaEuro areaEurope & Central AsiaEurope & Central Asia (excluding high income)Europe & Central Asia (IDA & IBRD countries)European UnionFaroe IslandsFijiFinlandFragile and conflict affected situationsFranceFrench PolynesiaGabonGambia, TheGeorgiaGermanyGhanaGreeceGrenadaGuatemalaGuineaGuinea-BissauGuyanaHaitiHeavily indebted poor countries (HIPC)High incomeHondurasHong Kong SAR, ChinaHungaryIBRD onlyIcelandIDA & IBRD totalIDA blendIDA onlyIDA totalIndiaIndonesiaIran, Islamic Rep.IraqIrelandIsraelItalyJamaicaJapanJordanKazakhstanKenyaKiribatiKorea, Rep.KosovoKuwaitKyrgyz RepublicLao PDRLate-demographic dividendLatin America & Caribbean Latin America & Caribbean (excluding high income)Latin America & the Caribbean (IDA & IBRD countries)LatviaLeast developed countries: UN classificationLebanonLesothoLiberiaLibyaLithuaniaLow & middle incomeLow incomeLower middle incomeLuxembourgMacao SAR, ChinaMacedonia, FYRMadagascarMalawiMalaysiaMaldivesMaliMaltaMauritaniaMauritiusMexicoMicronesia, Fed. Sts.Middle East & North AfricaMiddle East & North Africa (excluding high income)Middle East & North Africa (IDA & IBRD countries)Middle incomeMoldovaMongoliaMontenegroMoroccoMozambiqueNamibiaNepalNetherlandsNew CaledoniaNew ZealandNicaraguaNigerNigeriaNorth AmericaNorwayOECD membersOmanOther small statesPakistanPanamaPapua New GuineaParaguayPeruPhilippinesPolandPortugalPost-demographic dividendPre-demographic dividendPuerto RicoQatarRomaniaRussian FederationRwandaSaudi ArabiaSenegalSerbiaSeychellesSierra LeoneSingaporeSlovak RepublicSloveniaSmall statesSolomon IslandsSomaliaSouth AfricaSouth AsiaSouth Asia (IDA & IBRD)South SudanSpainSri LankaSt. Kitts and NevisSt. LuciaSt. Vincent and the GrenadinesSub-Saharan Africa Sub-Saharan Africa (excluding high income)Sub-Saharan Africa (IDA & IBRD countries)SudanSurinameSwazilandSwedenSwitzerlandSyrian Arab RepublicTajikistanTanzaniaThailandTimor-LesteTogoTongaTrinidad and TobagoTunisiaTurkeyTurkmenistanUgandaUkraineUnited Arab EmiratesUnited KingdomUnited StatesUpper middle incomeUruguayUzbekistanVanuatuVenezuela, RBVietnamWest Bank and GazaWorldYemen, Rep.ZambiaZimbabwe Timeline:
This timeline shows a graph from 1985 to 2016 of Albania. No data until 1984. Number of actual observations by date: 32.
Source name:
World Development Indicators
Source organization:
World Bank national accounts data, and OECD National Accounts data files.
Categories, topics:
Economy & Growth
Last updated:
apr 23, 2017
Indicators value changes by year
Minimum:
139.62 mln
jan 1, 1993
Maximum:
1.515 bln
jan 1, 2015
At the date of observation
Value
Absolute change
Change from previous value
jan 1, 1985
181.119 mln
+181.119 mln
0.0%
jan 1, 1986
182.867 mln
+1.748 mln
0.97%
jan 1, 1987
201.625 mln
+18.758 mln
10.26%
jan 1, 1988
208.0 mln
+6.375 mln
3.16%
jan 1, 1989
201.125 mln
-6.875 mln
-3.31%
jan 1, 1990
205.75 mln
+4.625 mln
2.3%
jan 1, 1991
389.25 mln
+183.5 mln
89.19%
jan 1, 1992
251.528 mln
-137.722 mln
-35.38%
jan 1, 1993
139.62 mln
-111.908 mln
-44.49%
jan 1, 1994
173.511 mln
+33.892 mln
24.27%
jan 1, 1995
275.059 mln
+101.548 mln
58.53%
jan 1, 1996
330.85 mln
+55.791 mln
20.28%
jan 1, 1997
304.806 mln
-26.045 mln
-7.87%
jan 1, 1998
239.721 mln
-65.085 mln
-21.35%
jan 1, 1999
277.765 mln
+38.044 mln
15.87%
jan 1, 2000
340.497 mln
+62.732 mln
22.58%
jan 1, 2001
343.409 mln
+2.912 mln
0.86%
jan 1, 2002
422.299 mln
+78.89 mln
22.97%
jan 1, 2003
495.505 mln
+73.206 mln
17.34%
jan 1, 2004
625.828 mln
+130.323 mln
26.3%
jan 1, 2005
803.383 mln
+177.555 mln
28.37%
jan 1, 2006
886.229 mln
+82.846 mln
10.31%
jan 1, 2007
911.398 mln
+25.169 mln
2.84%
jan 1, 2008
1.088 bln
+176.228 mln
19.34%
jan 1, 2009
1.337 bln
+249.324 mln
22.92%
jan 1, 2010
1.338 bln
+1.093 mln
0.08%
jan 1, 2011
1.331 bln
-7.31 mln
-0.55%
jan 1, 2012
1.415 bln
+83.931 mln
6.31%
jan 1, 2013
1.336 bln
-78.607 mln
-5.56%
jan 1, 2014
1.389 bln
+53.167 mln
3.98%
jan 1, 2015
1.515 bln
+125.663 mln
9.05%
jan 1, 2016
1.159 bln
-355.402 mln
-23.46%
Ranking of countries by current statistics by years


Comments: