29
/
en
AIzaSyAYiBZKx7MnpbEhh9jyipgxe19OcubqV5w
April 1, 2024
99611
Cameroon
CMR
true
2
1
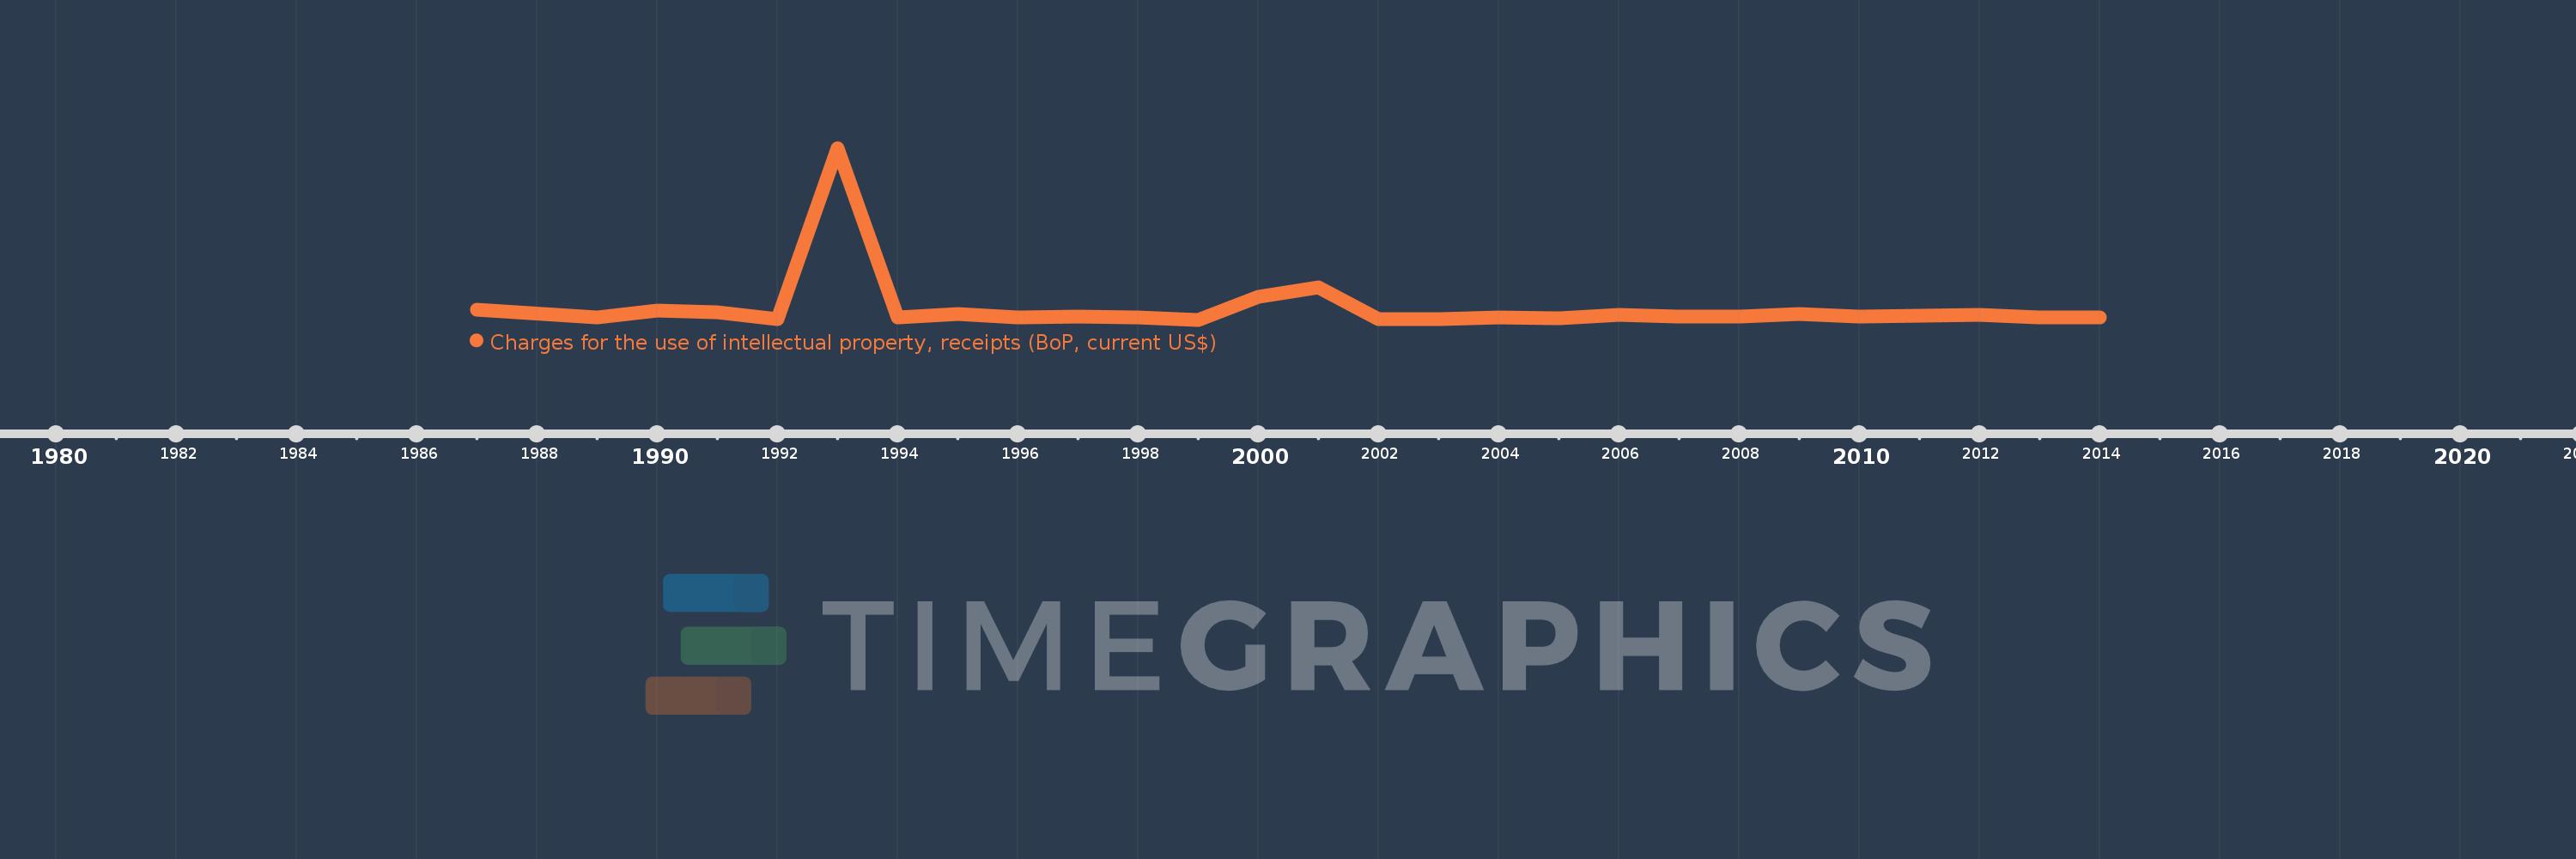
Charges for the use of intellectual property, receipts (BoP, current US$)
2014,2013,2012,2011,2010,2009,2008,2007,2006,2005,2004,2003,2002,2001,2000,1999,1998,1997,1996,1995,1994,1993,1992,1991,1990,1989,1987
This statistics in other country:
Timeline:
This timeline shows a graph from 1987 to 2014 of Cameroon. No data until 1986. Number of actual observations by date: 27.
Source name:
World Development Indicators
Source organization:
International Monetary Fund, Balance of Payments Statistics Yearbook and data files.
Categories, topics:
Economy & Growth, Science & Technology
Last updated:
apr 23, 2017
Indicators value changes by year
Minimum:
1.017K
jan 1, 1999
Maximum:
13.11 mln
jan 1, 1993
At the date of observation
Value
Absolute change
Change from previous value
jan 1, 1987
750.781K
+750.781K
0.0%
jan 1, 1989
201.445K
-549.336K
-73.17%
jan 1, 1990
720.984K
+519.539K
257.91%
jan 1, 1991
550.934K
-170.05K
-23.59%
jan 1, 1992
35.448K
-515.487K
-93.57%
jan 1, 1993
13.11 mln
+13.074 mln
36.88K%
jan 1, 1994
176.577K
-12.933 mln
-98.65%
jan 1, 1995
432.273K
+255.696K
144.81%
jan 1, 1996
180.307K
-251.966K
-58.29%
jan 1, 1997
273.677K
+93.37K
51.78%
jan 1, 1998
171.33K
-102.347K
-37.4%
jan 1, 1999
1.017K
-170.313K
-99.41%
jan 1, 2000
1.733 mln
+1.731 mln
170.25K%
jan 1, 2001
2.454 mln
+721.372K
41.64%
jan 1, 2002
56.068K
-2.398 mln
-97.72%
jan 1, 2003
44.621K
-11.447K
-20.42%
jan 1, 2004
161.39K
+116.77K
261.69%
jan 1, 2005
121.147K
-40.243K
-24.94%
jan 1, 2006
346.94K
+225.794K
186.38%
jan 1, 2007
229.494K
-117.447K
-33.85%
jan 1, 2008
250.382K
+20.889K
9.1%
jan 1, 2009
410.893K
+160.51K
64.11%
jan 1, 2010
222.37K
-188.523K
-45.88%
jan 1, 2011
316.994K
+94.624K
42.55%
jan 1, 2012
404.776K
+87.782K
27.69%
jan 1, 2013
191.958K
-212.817K
-52.58%
jan 1, 2014
204.437K
+12.478K
6.5%
Ranking of countries by current statistics by years


Comments: