29
/
en
AIzaSyAYiBZKx7MnpbEhh9jyipgxe19OcubqV5w
April 1, 2024
37983
IDA blend
IDB
false
2
1
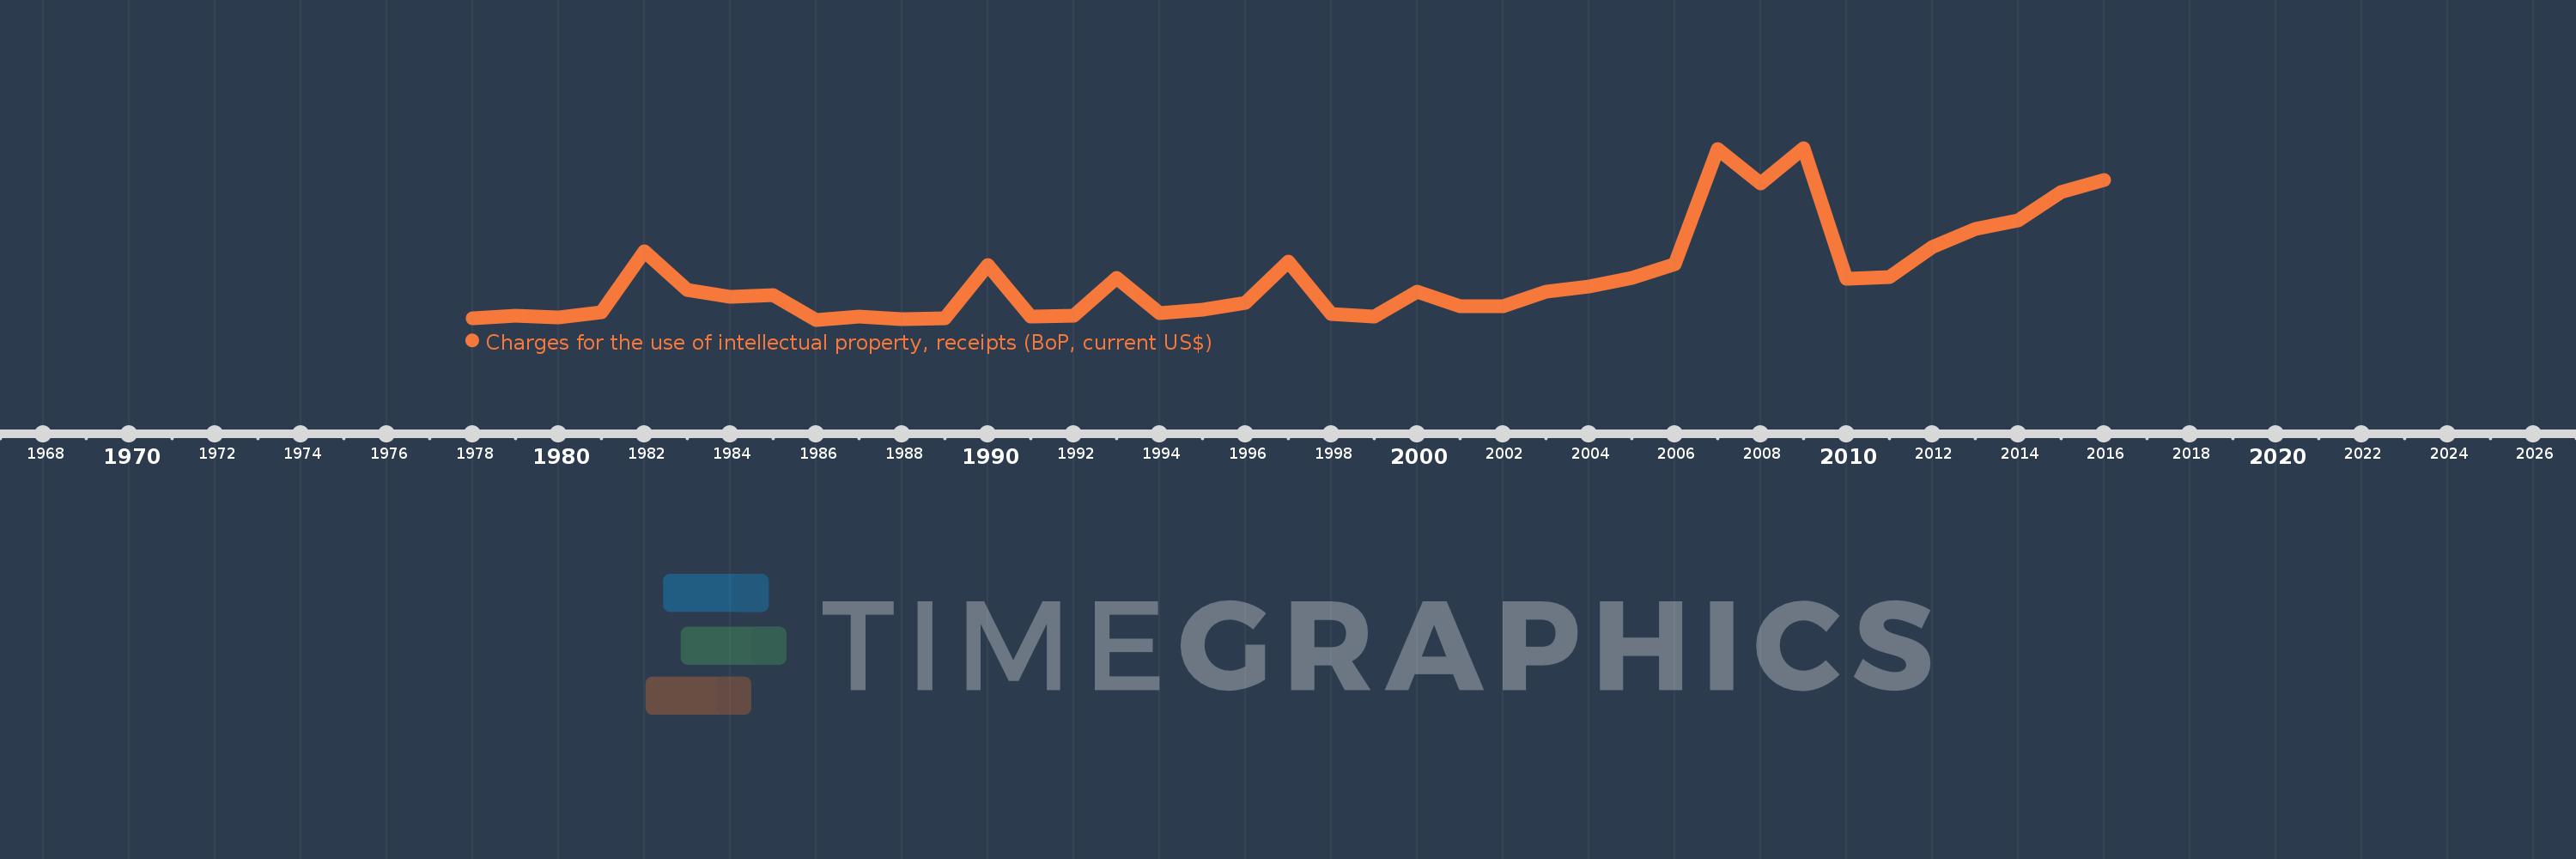
Charges for the use of intellectual property, receipts (BoP, current US$)
2016,2015,2014,2013,2012,2011,2010,2009,2008,2007,2006,2005,2004,2003,2002,2001,2000,1999,1998,1997,1996,1995,1994,1993,1992,1991,1990,1989,1988,1987,1986,1985,1984,1983,1982,1981,1980,1979,1978
This statistics in other country:
Timeline:
This timeline shows a graph from 1978 to 2016 of IDA blend. No data until 1977. Number of actual observations by date: 39.
Source name:
World Development Indicators
Source organization:
International Monetary Fund, Balance of Payments Statistics Yearbook and data files.
Categories, topics:
Economy & Growth, Science & Technology
Last updated:
apr 23, 2017
Indicators value changes by year
Minimum:
374.333K
jan 1, 1986
Maximum:
57.161 mln
jan 1, 2009
At the date of observation
Value
Absolute change
Change from previous value
jan 1, 1978
794.832K
+794.832K
0.0%
jan 1, 1979
1.778 mln
+983.409K
123.73%
jan 1, 1980
1.029 mln
-749.582K
-42.15%
jan 1, 1981
2.789 mln
+1.761 mln
171.17%
jan 1, 1982
23.055 mln
+20.266 mln
726.52%
jan 1, 1983
10.36 mln
-12.695 mln
-55.06%
jan 1, 1984
7.887 mln
-2.473 mln
-23.87%
jan 1, 1985
8.452 mln
+565.5K
7.17%
jan 1, 1986
374.333K
-8.078 mln
-95.57%
jan 1, 1987
1.346 mln
+971.984K
259.66%
jan 1, 1988
540.451K
-805.866K
-59.86%
jan 1, 1989
755.872K
+215.421K
39.86%
jan 1, 1990
18.491 mln
+17.736 mln
2.35K%
jan 1, 1991
1.326 mln
-17.166 mln
-92.83%
jan 1, 1992
1.644 mln
+318.209K
24.0%
jan 1, 1993
14.261 mln
+12.617 mln
767.41%
jan 1, 1994
2.432 mln
-11.829 mln
-82.95%
jan 1, 1995
3.555 mln
+1.123 mln
46.2%
jan 1, 1996
6.029 mln
+2.474 mln
69.58%
jan 1, 1997
19.593 mln
+13.564 mln
224.98%
jan 1, 1998
2.153 mln
-17.439 mln
-89.01%
jan 1, 1999
1.388 mln
-765.793K
-35.56%
jan 1, 2000
9.625 mln
+8.238 mln
593.62%
jan 1, 2001
4.772 mln
-4.853 mln
-50.42%
jan 1, 2002
4.956 mln
+183.729K
3.85%
jan 1, 2003
9.716 mln
+4.76 mln
96.05%
jan 1, 2004
11.326 mln
+1.61 mln
16.57%
jan 1, 2005
14.171 mln
+2.846 mln
25.13%
jan 1, 2006
18.857 mln
+4.686 mln
33.07%
jan 1, 2007
56.754 mln
+37.897 mln
200.97%
jan 1, 2008
45.521 mln
-11.233 mln
-19.79%
jan 1, 2009
57.161 mln
+11.64 mln
25.57%
jan 1, 2010
14.044 mln
-43.117 mln
-75.43%
jan 1, 2011
14.362 mln
+318.568K
2.27%
jan 1, 2012
24.345 mln
+9.983 mln
69.51%
jan 1, 2013
30.466 mln
+6.121 mln
25.14%
jan 1, 2014
33.252 mln
+2.787 mln
9.15%
jan 1, 2015
42.576 mln
+9.324 mln
28.04%
jan 1, 2016
46.566 mln
+3.99 mln
9.37%
Ranking of countries by current statistics by years


Comments: