29
/
en
AIzaSyAYiBZKx7MnpbEhh9jyipgxe19OcubqV5w
April 1, 2024
67493
Angola
AGO
true
2
1
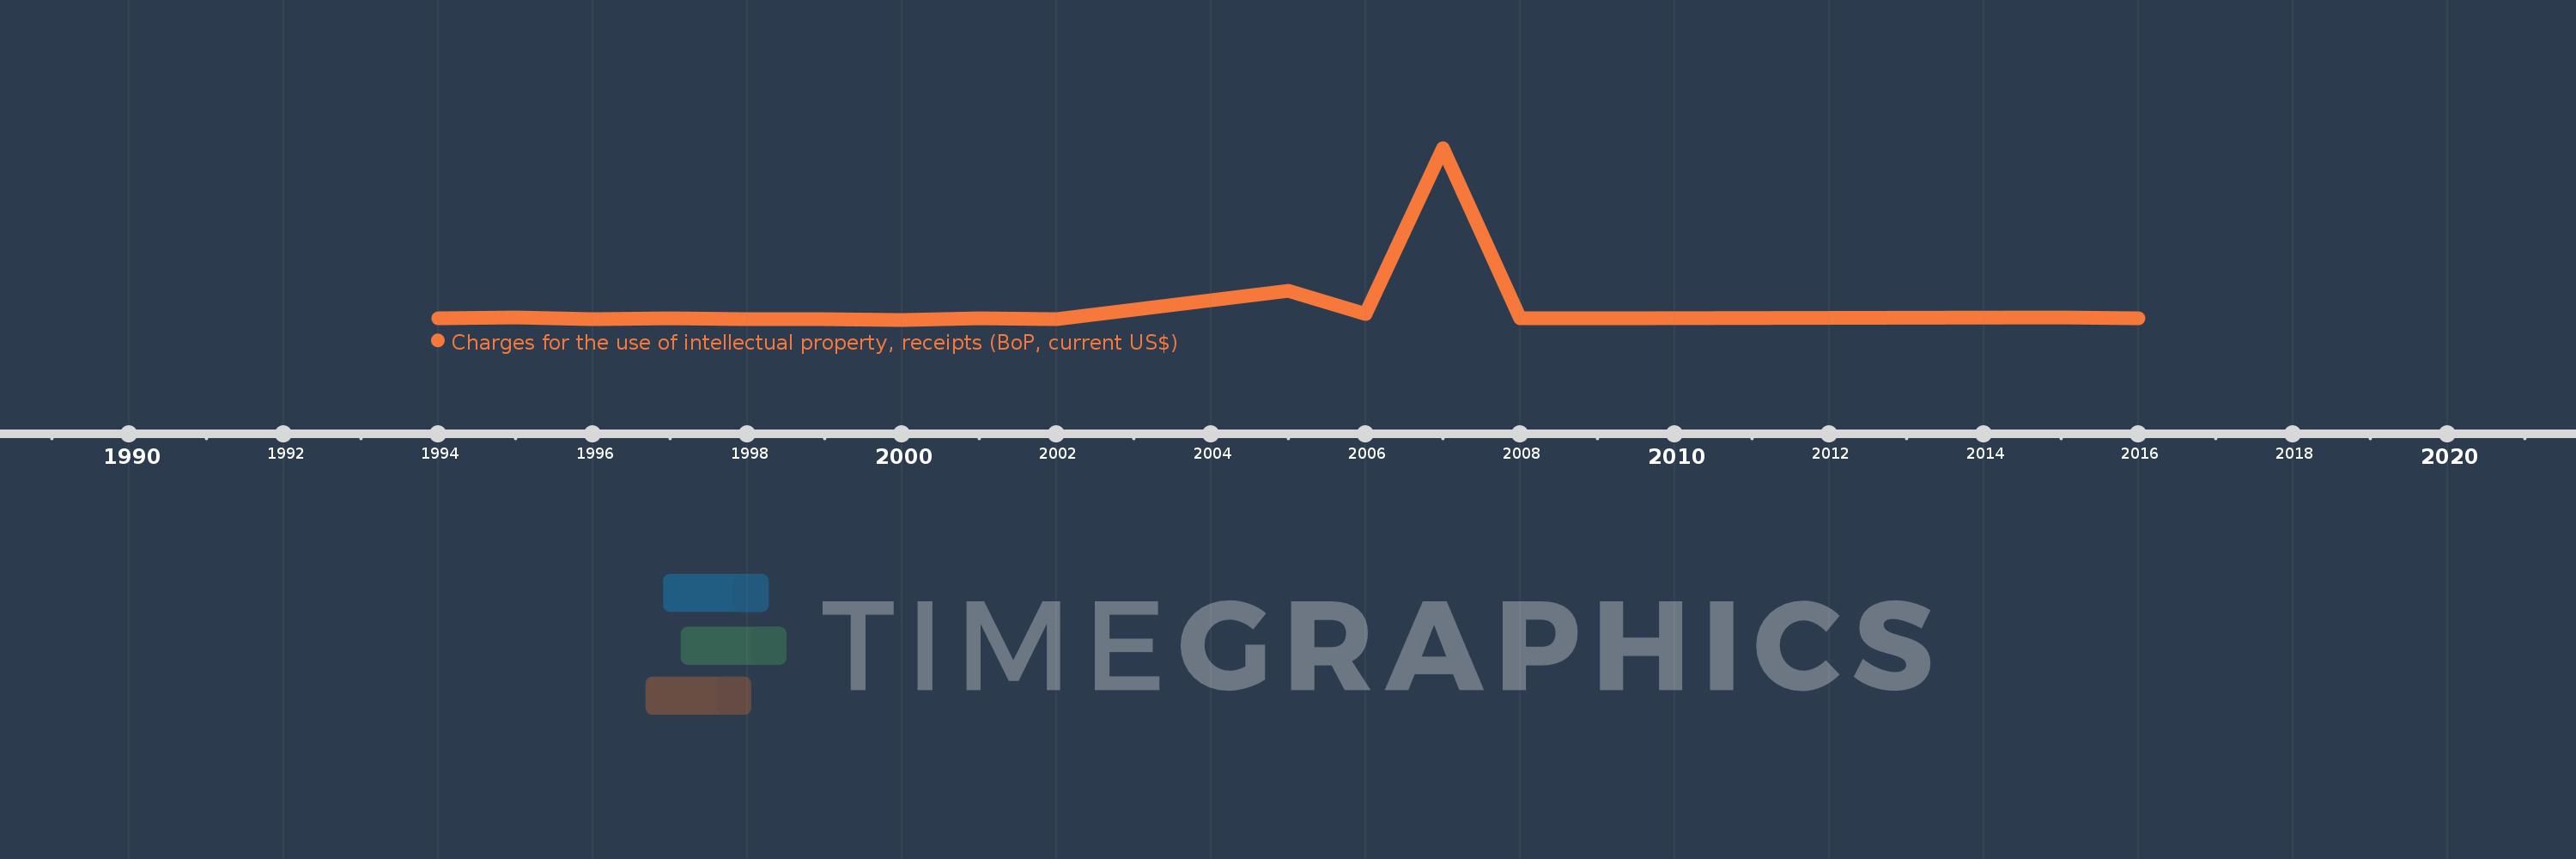
Charges for the use of intellectual property, receipts (BoP, current US$)
2016,2015,2009,2008,2007,2006,2005,2002,2001,2000,1999,1998,1997,1996,1995,1994
This statistics in other country:
Timeline:
This timeline shows a graph from 1994 to 2016 of Angola. No data until 1993. Number of actual observations by date: 16.
Source name:
World Development Indicators
Source organization:
International Monetary Fund, Balance of Payments Statistics Yearbook and data files.
Categories, topics:
Economy & Growth, Science & Technology
Last updated:
apr 23, 2017
Indicators value changes by year
Minimum:
2.79 mln
jan 1, 2000
Maximum:
1.34 bln
jan 1, 2007
At the date of observation
Value
Absolute change
Change from previous value
jan 1, 1994
14.1 mln
+14.1 mln
0.0%
jan 1, 1995
18.3 mln
+4.2 mln
29.79%
jan 1, 1996
7.421 mln
-10.879 mln
-59.45%
jan 1, 1997
16.587 mln
+9.166 mln
123.51%
jan 1, 1998
5.96 mln
-10.627 mln
-64.07%
jan 1, 1999
9.48 mln
+3.52 mln
59.06%
jan 1, 2000
2.79 mln
-6.69 mln
-70.57%
jan 1, 2001
15.75 mln
+12.96 mln
464.52%
jan 1, 2002
4.42 mln
-11.33 mln
-71.94%
jan 1, 2005
226.8 mln
+222.38 mln
5.03K%
jan 1, 2006
49.431 mln
-177.369 mln
-78.21%
jan 1, 2007
1.34 bln
+1.29 bln
2.61K%
jan 1, 2008
12.022 mln
-1.328 bln
-99.1%
jan 1, 2009
12.0 mln
-21.694K
-0.18%
jan 1, 2015
21.944 mln
+9.944 mln
82.87%
jan 1, 2016
17.491 mln
-4.453 mln
-20.29%
Ranking of countries by current statistics by years


Comments: