29
/
en
AIzaSyAYiBZKx7MnpbEhh9jyipgxe19OcubqV5w
April 1, 2024
44875
Low & middle income
LMY
false
2
1
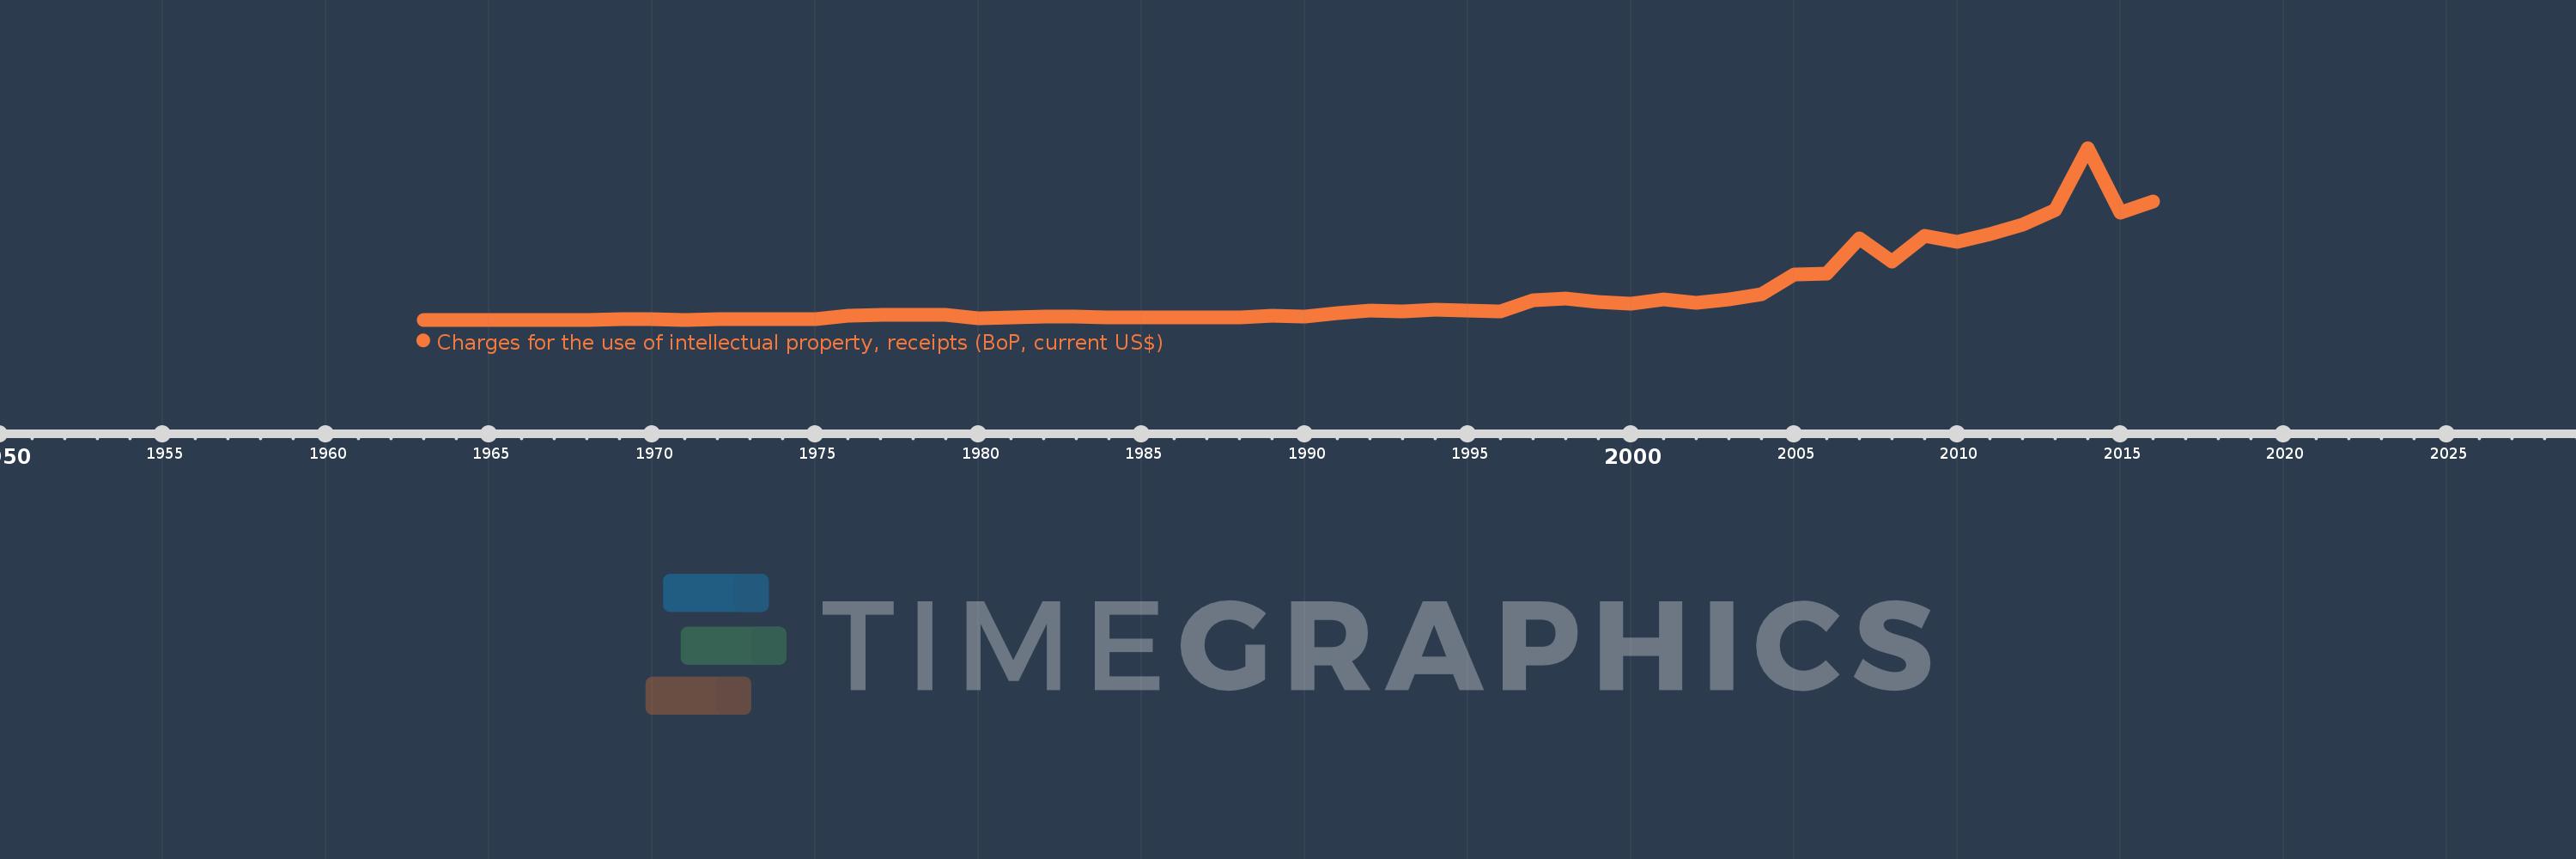
Charges for the use of intellectual property, receipts (BoP, current US$)
2016,2015,2014,2013,2012,2011,2010,2009,2008,2007,2006,2005,2004,2003,2002,2001,2000,1999,1998,1997,1996,1995,1994,1993,1992,1991,1990,1989,1988,1987,1986,1985,1984,1983,1982,1981,1980,1979,1978,1977,1976,1975,1974,1973,1972,1971,1970,1969,1968,1967,1966,1965,1964,1963
This statistics in other country:
Timeline:
This timeline shows a graph from 1963 to 2016 of Low & middle income. No data until 1962. Number of actual observations by date: 54.
Source name:
World Development Indicators
Source organization:
International Monetary Fund, Balance of Payments Statistics Yearbook and data files.
Categories, topics:
Economy & Growth, Science & Technology
Last updated:
apr 23, 2017
Indicators value changes by year
Minimum:
1.4 mln
jan 1, 1964
Maximum:
6.261 bln
jan 1, 2014
At the date of observation
Value
Absolute change
Change from previous value
jan 1, 1963
2.8 mln
+2.8 mln
0.0%
jan 1, 1964
1.4 mln
-1.4 mln
-50.0%
jan 1, 1965
2.8 mln
+1.4 mln
100.0%
jan 1, 1966
2.8 mln
0.0
0.0%
jan 1, 1967
2.8 mln
0.0
0.0%
jan 1, 1968
4.2 mln
+1.4 mln
50.0%
jan 1, 1969
13.6 mln
+9.4 mln
223.81%
jan 1, 1970
10.8 mln
-2.8 mln
-20.59%
jan 1, 1971
7.2 mln
-3.6 mln
-33.33%
jan 1, 1972
9.994 mln
+2.794 mln
38.81%
jan 1, 1973
12.424 mln
+2.429 mln
24.31%
jan 1, 1974
8.157 mln
-4.266 mln
-34.34%
jan 1, 1975
9.825 mln
+1.667 mln
20.44%
jan 1, 1976
152.586 mln
+142.761 mln
1.45K%
jan 1, 1977
177.544 mln
+24.958 mln
16.36%
jan 1, 1978
167.749 mln
-9.795 mln
-5.52%
jan 1, 1979
184.703 mln
+16.954 mln
10.11%
jan 1, 1980
44.617 mln
-140.086 mln
-75.84%
jan 1, 1981
71.301 mln
+26.684 mln
59.81%
jan 1, 1982
120.686 mln
+49.385 mln
69.26%
jan 1, 1983
108.588 mln
-12.097 mln
-10.02%
jan 1, 1984
88.449 mln
-20.139 mln
-18.55%
jan 1, 1985
86.347 mln
-2.102 mln
-2.38%
jan 1, 1986
79.229 mln
-7.117 mln
-8.24%
jan 1, 1987
75.08 mln
-4.149 mln
-5.24%
jan 1, 1988
84.878 mln
+9.798 mln
13.05%
jan 1, 1989
146.209 mln
+61.331 mln
72.26%
jan 1, 1990
123.154 mln
-23.055 mln
-15.77%
jan 1, 1991
239.538 mln
+116.384 mln
94.5%
jan 1, 1992
333.227 mln
+93.688 mln
39.11%
jan 1, 1993
316.725 mln
-16.502 mln
-4.95%
jan 1, 1994
373.97 mln
+57.245 mln
18.07%
jan 1, 1995
321.029 mln
-52.941 mln
-14.16%
jan 1, 1996
305.921 mln
-15.107 mln
-4.71%
jan 1, 1997
724.187 mln
+418.266 mln
136.72%
jan 1, 1998
786.076 mln
+61.889 mln
8.55%
jan 1, 1999
647.616 mln
-138.46 mln
-17.61%
jan 1, 2000
577.088 mln
-70.528 mln
-10.89%
jan 1, 2001
733.287 mln
+156.199 mln
27.07%
jan 1, 2002
630.718 mln
-102.57 mln
-13.99%
jan 1, 2003
744.606 mln
+113.888 mln
18.06%
jan 1, 2004
944.429 mln
+199.823 mln
26.84%
jan 1, 2005
1.661 bln
+716.52 mln
75.87%
jan 1, 2006
1.682 bln
+21.456 mln
1.29%
jan 1, 2007
2.966 bln
+1.284 bln
76.3%
jan 1, 2008
2.121 bln
-845.007 mln
-28.49%
jan 1, 2009
3.047 bln
+926.266 mln
43.67%
jan 1, 2010
2.852 bln
-195.201 mln
-6.41%
jan 1, 2011
3.134 bln
+281.606 mln
9.87%
jan 1, 2012
3.452 bln
+318.593 mln
10.17%
jan 1, 2013
4.007 bln
+554.723 mln
16.07%
jan 1, 2014
6.261 bln
+2.254 bln
56.24%
jan 1, 2015
3.904 bln
-2.357 bln
-37.64%
jan 1, 2016
4.326 bln
+422.027 mln
10.81%
Ranking of countries by current statistics by years


Comments: