29
/
en
AIzaSyAYiBZKx7MnpbEhh9jyipgxe19OcubqV5w
April 1, 2024
160271
Israel
ISR
true
2
1
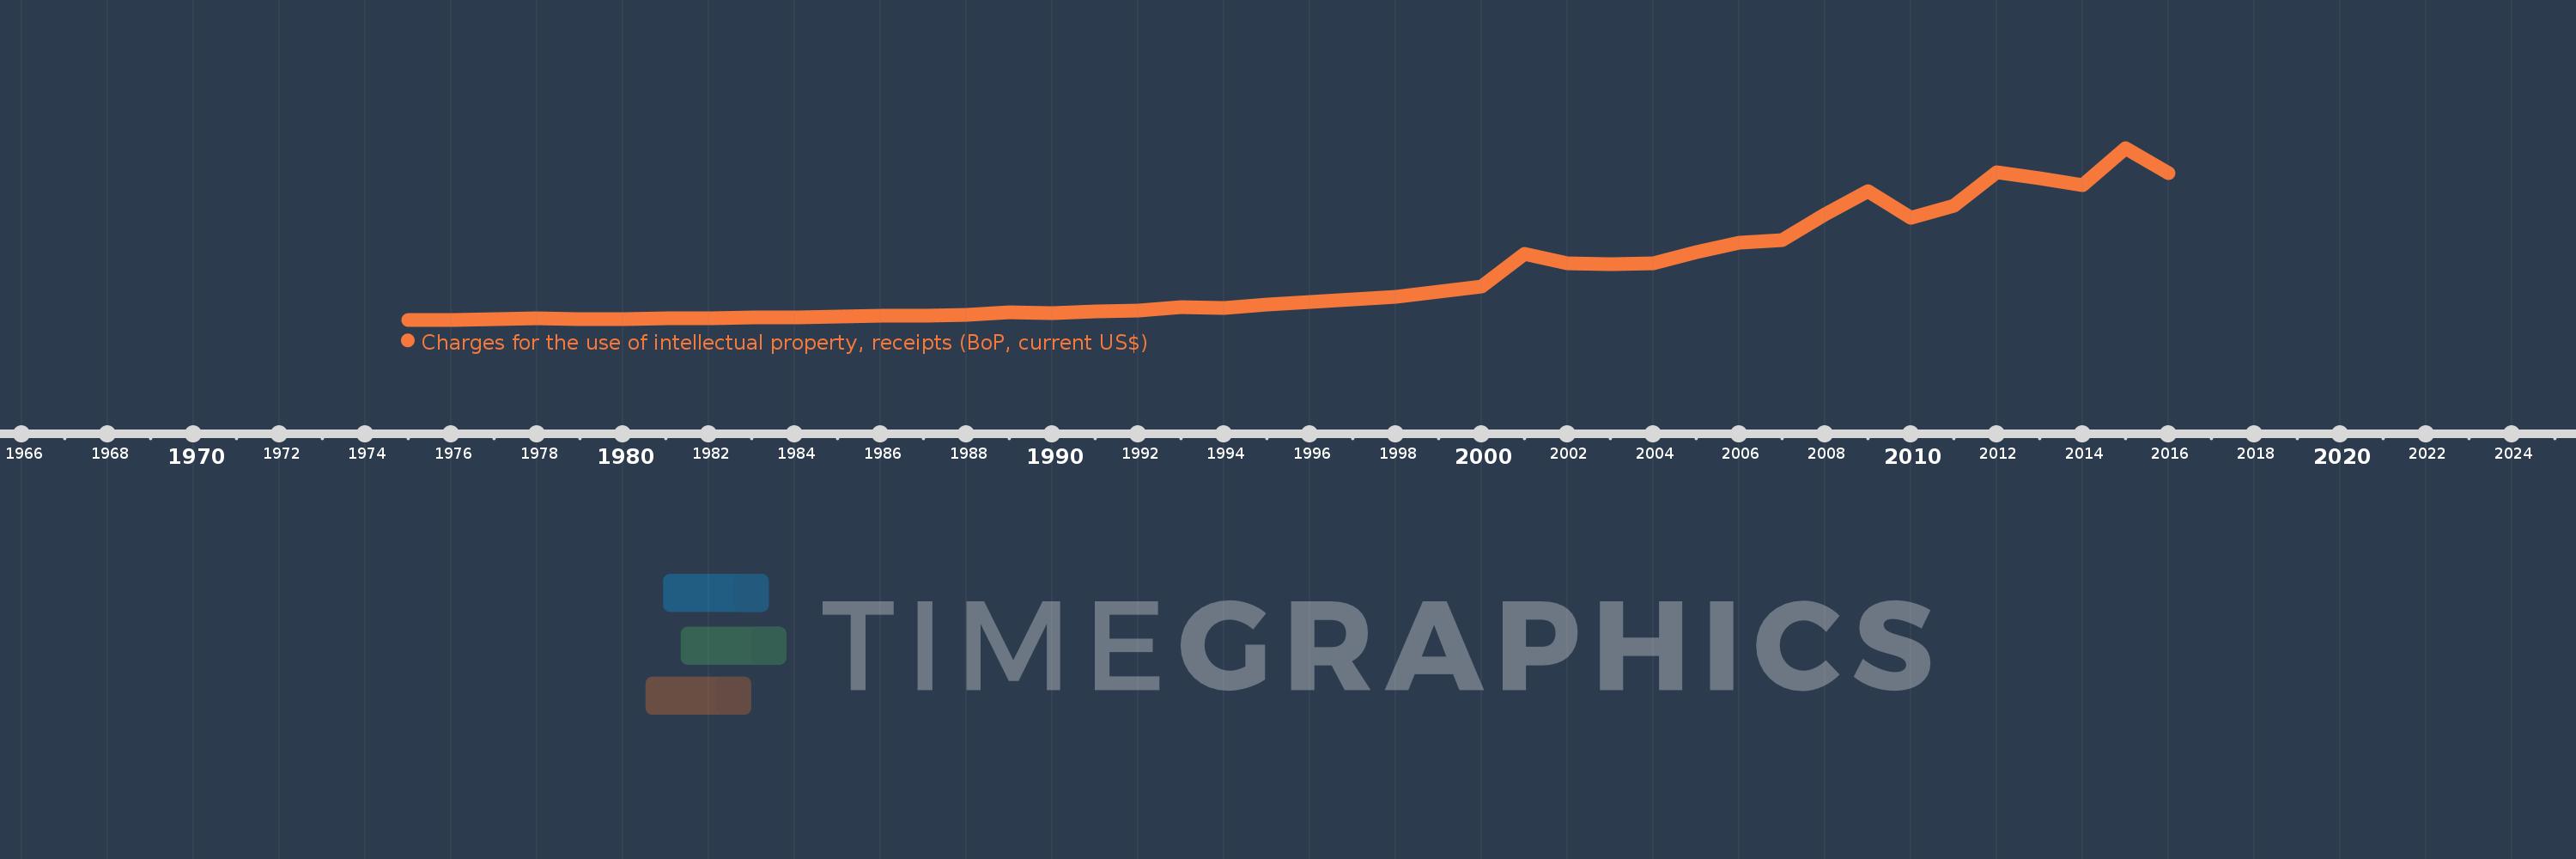
Charges for the use of intellectual property, receipts (BoP, current US$)
2016,2015,2014,2013,2012,2011,2010,2009,2008,2007,2006,2005,2004,2003,2002,2001,2000,1999,1998,1997,1996,1995,1994,1993,1992,1991,1990,1989,1988,1987,1986,1985,1984,1983,1982,1981,1980,1979,1978,1977,1976,1975
This statistics in other country:
Timeline:
This timeline shows a graph from 1975 to 2016 of Israel. No data until 1974. Number of actual observations by date: 42.
Source name:
World Development Indicators
Source organization:
International Monetary Fund, Balance of Payments Statistics Yearbook and data files.
Categories, topics:
Economy & Growth, Science & Technology
Last updated:
apr 23, 2017
Indicators value changes by year
Minimum:
4.0 mln
jan 1, 1975
Maximum:
1.281 bln
jan 1, 2015
At the date of observation
Value
Absolute change
Change from previous value
jan 1, 1975
4.0 mln
+4.0 mln
0.0%
jan 1, 1976
5.0 mln
+1000.0K
25.0%
jan 1, 1977
6.0 mln
+1000.0K
20.0%
jan 1, 1978
12.0 mln
+6.0 mln
100.0%
jan 1, 1979
9.0 mln
-3.0 mln
-25.0%
jan 1, 1980
10.0 mln
+1000.0K
11.11%
jan 1, 1981
12.0 mln
+2.0 mln
20.0%
jan 1, 1982
13.9 mln
+1.9 mln
15.83%
jan 1, 1983
20.8 mln
+6.9 mln
49.64%
jan 1, 1984
21.8 mln
+1000.0K
4.81%
jan 1, 1985
27.6 mln
+5.8 mln
26.61%
jan 1, 1986
32.6 mln
+5.0 mln
18.12%
jan 1, 1987
34.6 mln
+2.0 mln
6.13%
jan 1, 1988
41.5 mln
+6.9 mln
19.94%
jan 1, 1989
62.0 mln
+20.5 mln
49.4%
jan 1, 1990
55.1 mln
-6.9 mln
-11.13%
jan 1, 1991
62.9 mln
+7.8 mln
14.16%
jan 1, 1992
70.4 mln
+7.5 mln
11.92%
jan 1, 1993
96.1 mln
+25.7 mln
36.51%
jan 1, 1994
92.0 mln
-4.1 mln
-4.27%
jan 1, 1995
115.5 mln
+23.5 mln
25.54%
jan 1, 1996
134.3 mln
+18.8 mln
16.28%
jan 1, 1997
158.2 mln
+23.9 mln
17.8%
jan 1, 1998
177.1 mln
+18.9 mln
11.95%
jan 1, 1999
215.6 mln
+38.5 mln
21.74%
jan 1, 2000
253.5 mln
+37.9 mln
17.58%
jan 1, 2001
496.1 mln
+242.6 mln
95.7%
jan 1, 2002
425.2 mln
-70.9 mln
-14.29%
jan 1, 2003
420.2 mln
-5.0 mln
-1.18%
jan 1, 2004
425.2 mln
+5.0 mln
1.19%
jan 1, 2005
504.7 mln
+79.5 mln
18.7%
jan 1, 2006
574.1 mln
+69.4 mln
13.75%
jan 1, 2007
593.0 mln
+18.9 mln
3.29%
jan 1, 2008
785.8 mln
+192.8 mln
32.51%
jan 1, 2009
956.7 mln
+170.9 mln
21.75%
jan 1, 2010
762.6 mln
-194.1 mln
-20.29%
jan 1, 2011
849.4 mln
+86.8 mln
11.38%
jan 1, 2012
1.099 bln
+250.1 mln
29.44%
jan 1, 2013
1.056 bln
-43.0 mln
-3.91%
jan 1, 2014
1.007 bln
-49.8 mln
-4.71%
jan 1, 2015
1.281 bln
+274.3 mln
27.25%
jan 1, 2016
1.096 bln
-184.9 mln
-14.43%
Ranking of countries by current statistics by years


Comments: