29
/
en
AIzaSyAYiBZKx7MnpbEhh9jyipgxe19OcubqV5w
April 1, 2024
256112
Sweden
SWE
true
2
1
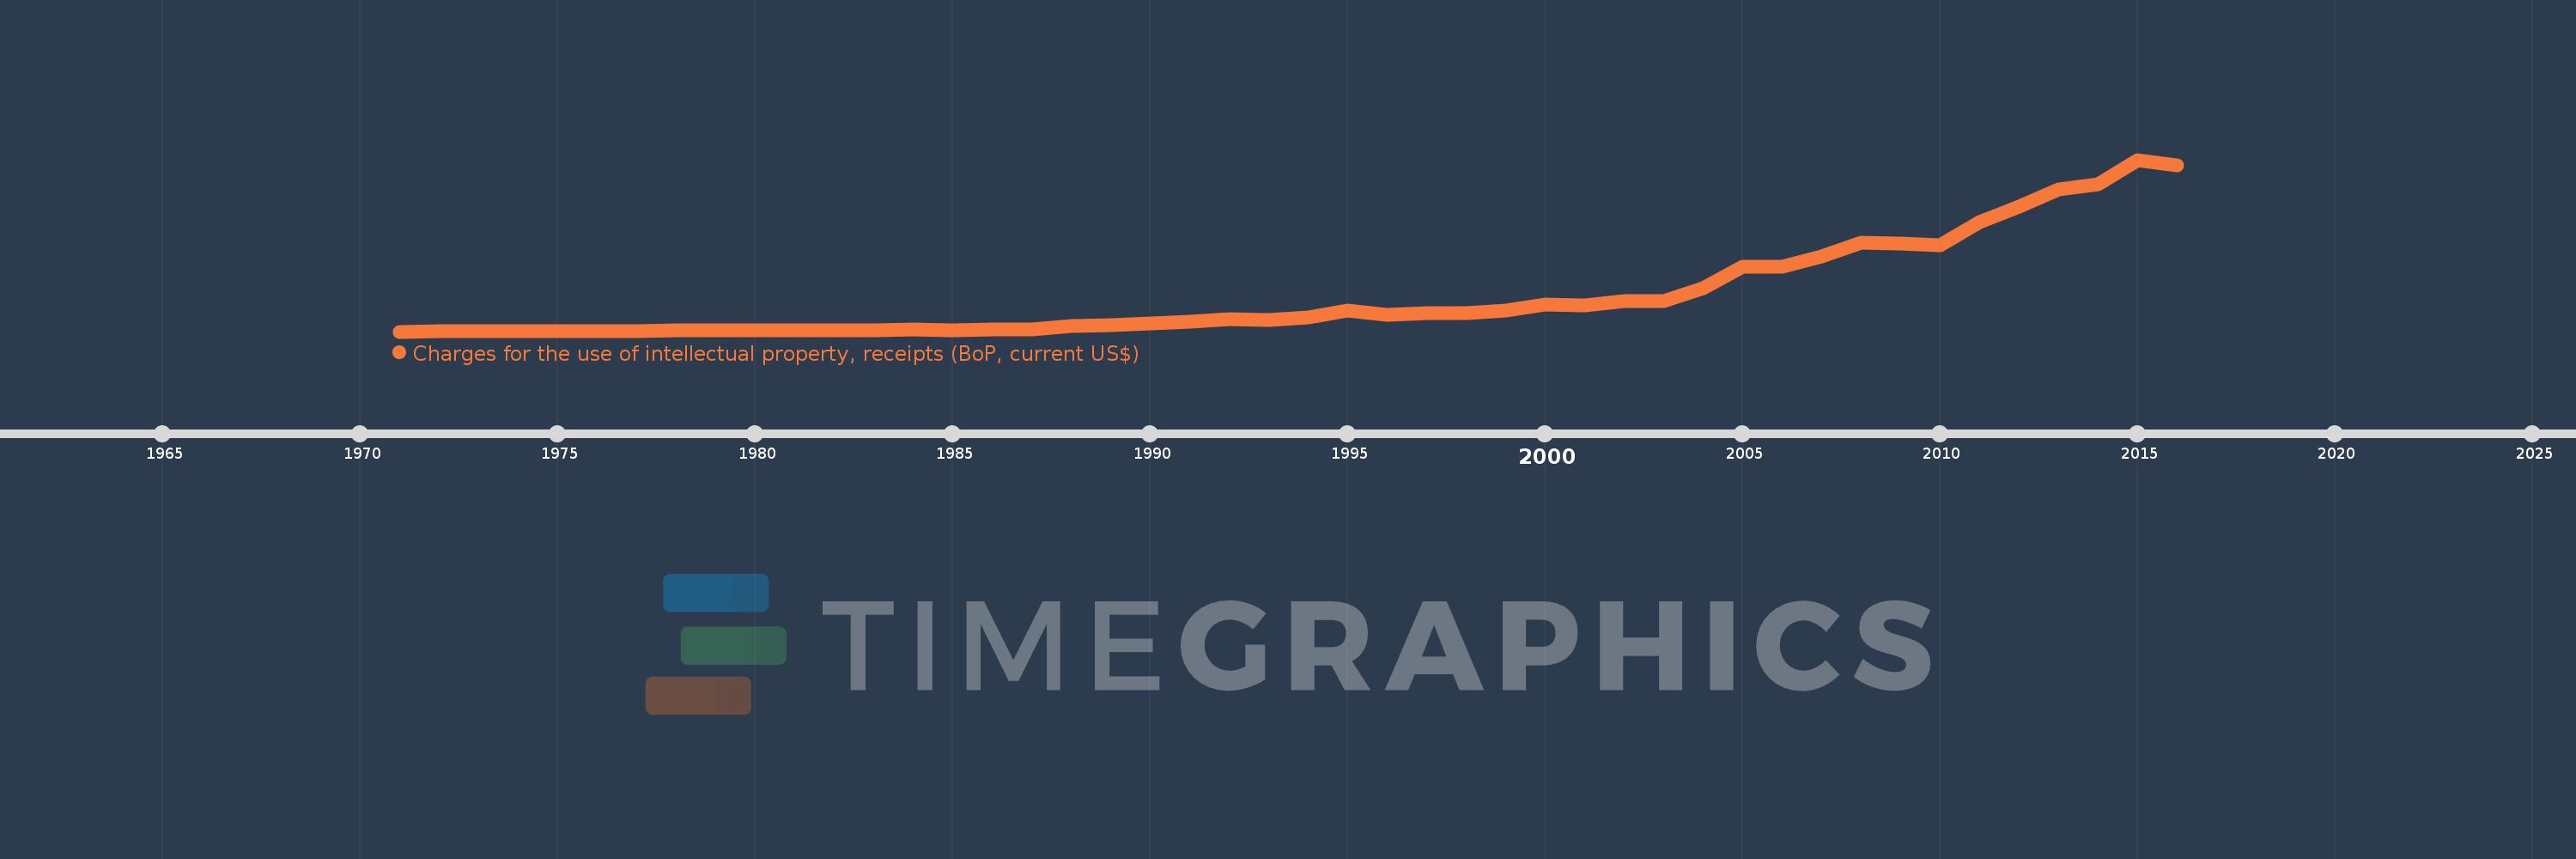
Charges for the use of intellectual property, receipts (BoP, current US$)
2016,2015,2014,2013,2012,2011,2010,2009,2008,2007,2006,2005,2004,2003,2002,2001,2000,1999,1998,1997,1996,1995,1994,1993,1992,1991,1990,1989,1988,1987,1986,1985,1984,1983,1982,1981,1980,1979,1978,1977,1976,1975,1974,1973,1972,1971
This statistics in other country:
Timeline:
This timeline shows a graph from 1971 to 2016 of Sweden. No data until 1970. Number of actual observations by date: 46.
Source name:
World Development Indicators
Source organization:
International Monetary Fund, Balance of Payments Statistics Yearbook and data files.
Categories, topics:
Economy & Growth, Science & Technology
Last updated:
apr 23, 2017
Indicators value changes by year
Minimum:
15.464 mln
jan 1, 1971
Maximum:
9.142 bln
jan 1, 2015
At the date of observation
Value
Absolute change
Change from previous value
jan 1, 1971
15.464 mln
+15.464 mln
0.0%
jan 1, 1972
15.607 mln
+142.713K
0.92%
jan 1, 1973
20.998 mln
+5.391 mln
34.54%
jan 1, 1974
36.636 mln
+15.639 mln
74.48%
jan 1, 1975
31.536 mln
-5.101 mln
-13.92%
jan 1, 1976
41.389 mln
+9.854 mln
31.25%
jan 1, 1977
59.859 mln
+18.47 mln
44.62%
jan 1, 1978
74.577 mln
+14.717 mln
24.59%
jan 1, 1979
70.774 mln
-3.802 mln
-5.1%
jan 1, 1980
90.981 mln
+20.207 mln
28.55%
jan 1, 1981
89.918 mln
-1.063 mln
-1.17%
jan 1, 1982
102.218 mln
+12.3 mln
13.68%
jan 1, 1983
74.321 mln
-27.897 mln
-27.29%
jan 1, 1984
143.322 mln
+69.001 mln
92.84%
jan 1, 1985
80.885 mln
-62.437 mln
-43.56%
jan 1, 1986
114.0 mln
+33.115 mln
40.94%
jan 1, 1987
122.775 mln
+8.775 mln
7.7%
jan 1, 1988
289.836 mln
+167.062 mln
136.07%
jan 1, 1989
363.993 mln
+74.157 mln
25.59%
jan 1, 1990
437.674 mln
+73.681 mln
20.24%
jan 1, 1991
563.022 mln
+125.348 mln
28.64%
jan 1, 1992
696.896 mln
+133.874 mln
23.78%
jan 1, 1993
640.93 mln
-55.966 mln
-8.03%
jan 1, 1994
747.54 mln
+106.61 mln
16.63%
jan 1, 1995
1.153 bln
+405.805 mln
54.29%
jan 1, 1996
888.603 mln
-264.743 mln
-22.95%
jan 1, 1997
997.111 mln
+108.508 mln
12.21%
jan 1, 1998
1.003 bln
+5.801 mln
0.58%
jan 1, 1999
1.132 bln
+129.077 mln
12.87%
jan 1, 2000
1.453 bln
+320.937 mln
28.35%
jan 1, 2001
1.414 bln
-38.505 mln
-2.65%
jan 1, 2002
1.645 bln
+231.016 mln
16.33%
jan 1, 2003
1.648 bln
+2.272 mln
0.14%
jan 1, 2004
2.331 bln
+683.452 mln
41.48%
jan 1, 2005
3.452 bln
+1.12 bln
48.06%
jan 1, 2006
3.48 bln
+28.522 mln
0.83%
jan 1, 2007
3.988 bln
+507.879 mln
14.59%
jan 1, 2008
4.733 bln
+744.494 mln
18.67%
jan 1, 2009
4.707 bln
-25.936 mln
-0.55%
jan 1, 2010
4.6 bln
-107.059 mln
-2.27%
jan 1, 2011
5.813 bln
+1.213 bln
26.38%
jan 1, 2012
6.64 bln
+827.206 mln
14.23%
jan 1, 2013
7.55 bln
+909.981 mln
13.7%
jan 1, 2014
7.833 bln
+283.071 mln
3.75%
jan 1, 2015
9.142 bln
+1.309 bln
16.71%
jan 1, 2016
8.828 bln
-314.423 mln
-3.44%
Ranking of countries by current statistics by years


Comments: