29
/
en
AIzaSyAYiBZKx7MnpbEhh9jyipgxe19OcubqV5w
April 1, 2024
202622
Mozambique
MOZ
true
2
1
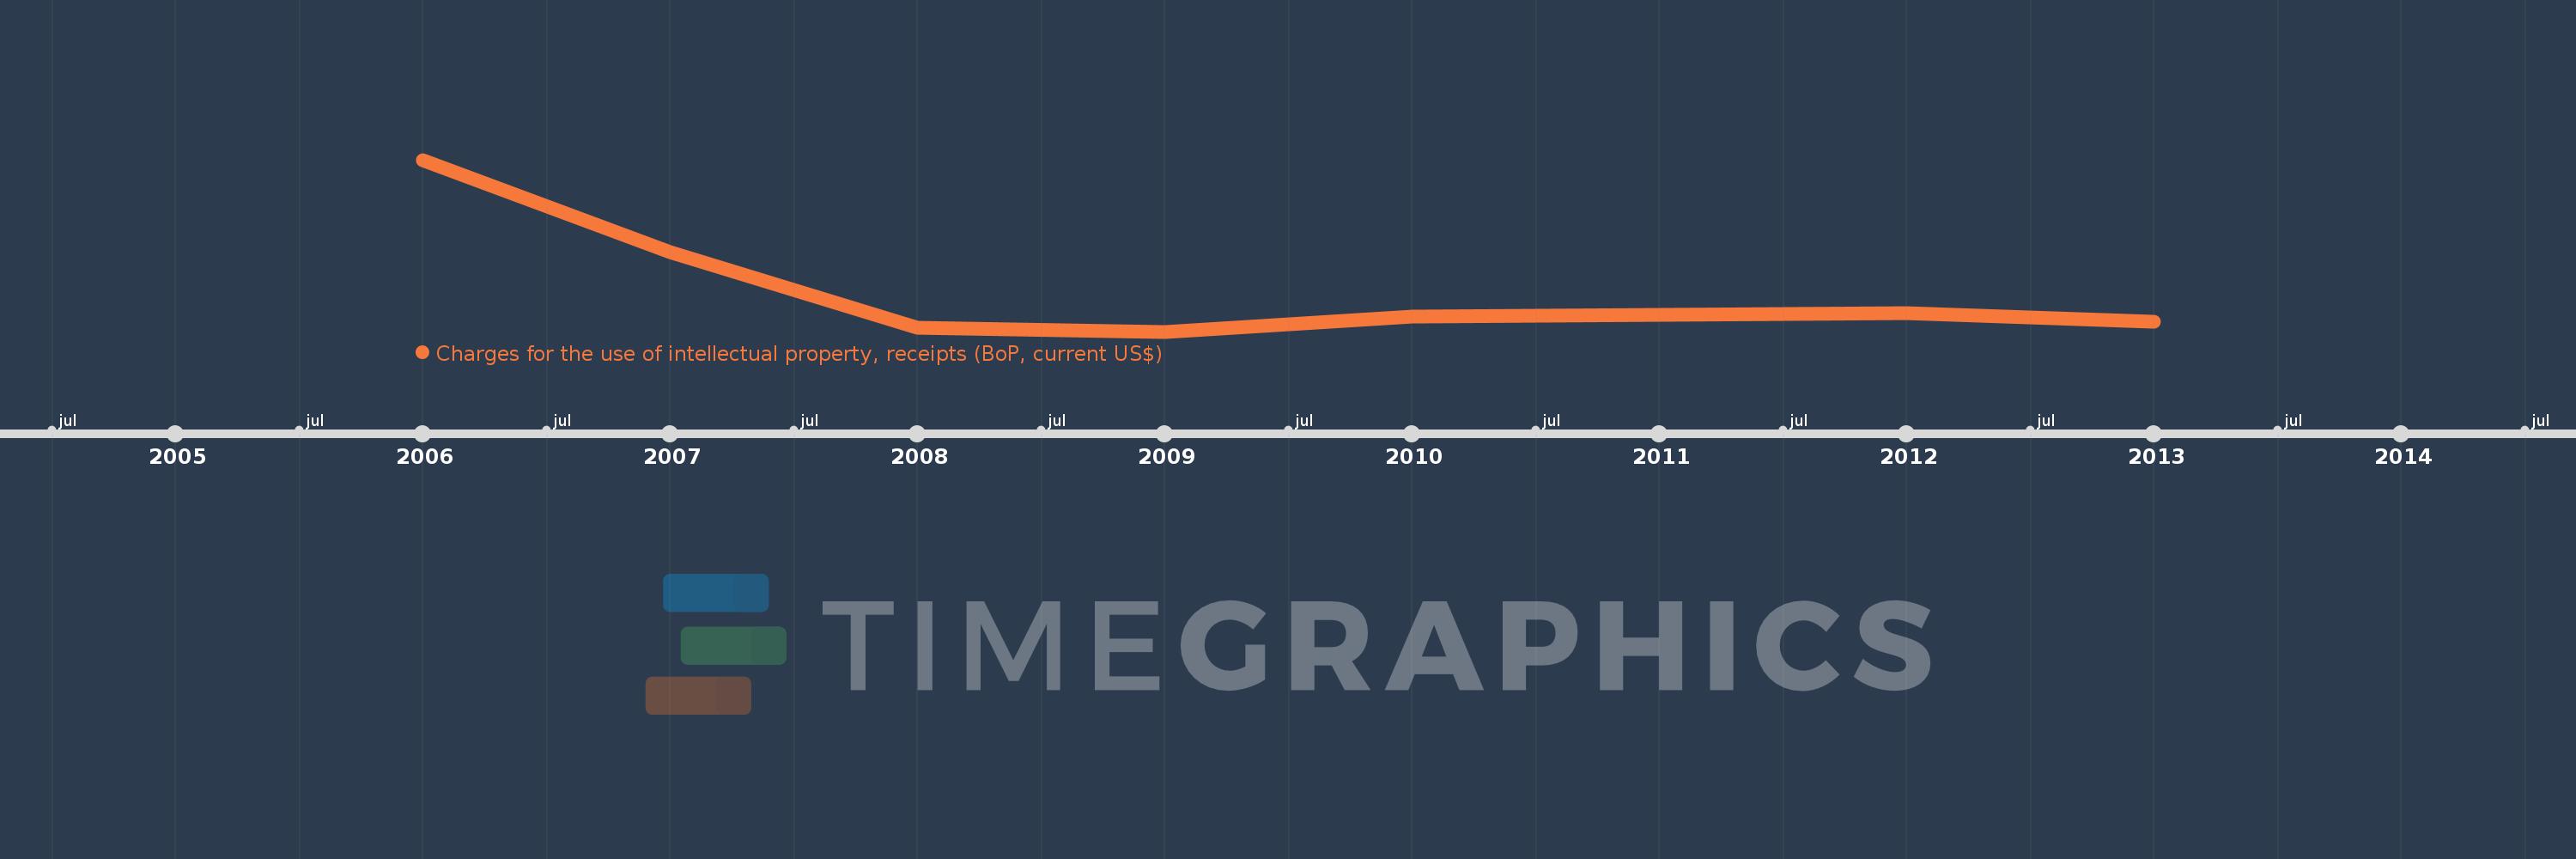
Charges for the use of intellectual property, receipts (BoP, current US$)
2013,2012,2010,2009,2008,2007,2006
This statistics in other country:
Timeline:
This timeline shows a graph from 2006 to 2013 of Mozambique. No data until 2005. Number of actual observations by date: 7.
Source name:
World Development Indicators
Source organization:
International Monetary Fund, Balance of Payments Statistics Yearbook and data files.
Categories, topics:
Economy & Growth, Science & Technology
Last updated:
apr 23, 2017
Indicators value changes by year
Minimum:
842.24
jan 1, 2009
Maximum:
2.203 mln
jan 1, 2006
At the date of observation
Value
Absolute change
Change from previous value
jan 1, 2006
2.203 mln
+2.203 mln
0.0%
jan 1, 2007
1.018 mln
-1.185 mln
-53.81%
jan 1, 2008
45.199K
-972.488K
-95.56%
jan 1, 2009
842.24
-44.357K
-98.14%
jan 1, 2010
192.949K
+192.106K
22.81K%
jan 1, 2012
241.796K
+48.847K
25.32%
jan 1, 2013
122.123K
-119.673K
-49.49%
Ranking of countries by current statistics by years


Comments: