29
/
en
AIzaSyAYiBZKx7MnpbEhh9jyipgxe19OcubqV5w
April 1, 2024
152301
Hungary
HUN
true
2
1
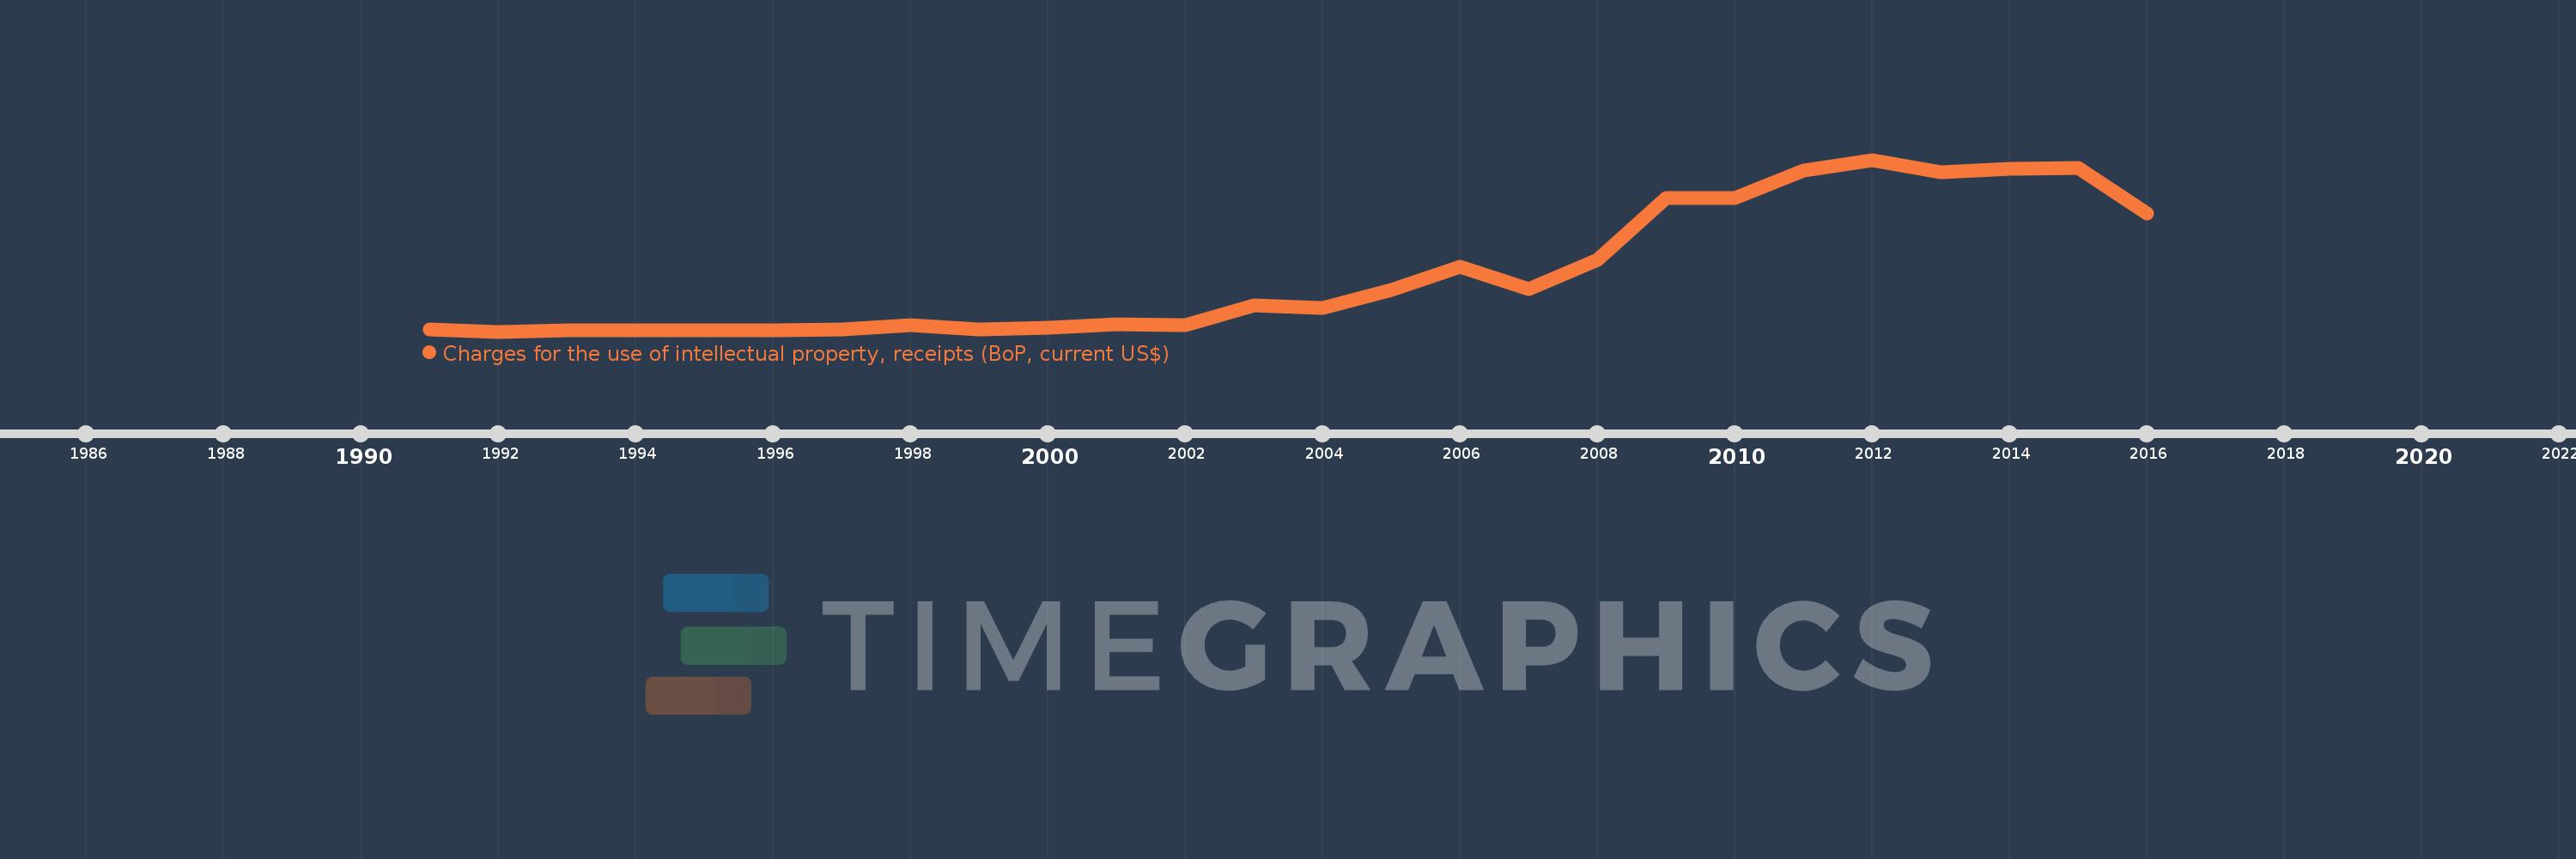
Charges for the use of intellectual property, receipts (BoP, current US$)
2016,2015,2014,2013,2012,2011,2010,2009,2008,2007,2006,2005,2004,2003,2002,2001,2000,1999,1998,1997,1996,1995,1994,1993,1992,1991
This statistics in other country:
Timeline:
This timeline shows a graph from 1991 to 2016 of Hungary. No data until 1990. Number of actual observations by date: 26.
Source name:
World Development Indicators
Source organization:
International Monetary Fund, Balance of Payments Statistics Yearbook and data files.
Categories, topics:
Economy & Growth, Science & Technology
Last updated:
apr 23, 2017
Indicators value changes by year
Minimum:
18.058 mln
jan 1, 1992
Maximum:
2.186 bln
jan 1, 2012
At the date of observation
Value
Absolute change
Change from previous value
jan 1, 1991
48.528 mln
+48.528 mln
0.0%
jan 1, 1992
18.058 mln
-30.47 mln
-62.79%
jan 1, 1993
38.259 mln
+20.201 mln
111.87%
jan 1, 1994
33.021 mln
-5.238 mln
-13.69%
jan 1, 1995
31.485 mln
-1.536 mln
-4.65%
jan 1, 1996
31.698 mln
+212.714K
0.68%
jan 1, 1997
44.956 mln
+13.258 mln
41.83%
jan 1, 1998
100.151 mln
+55.196 mln
122.78%
jan 1, 1999
46.393 mln
-53.759 mln
-53.68%
jan 1, 2000
61.948 mln
+15.556 mln
33.53%
jan 1, 2001
111.789 mln
+49.841 mln
80.46%
jan 1, 2002
95.666 mln
-16.123 mln
-14.42%
jan 1, 2003
349.305 mln
+253.639 mln
265.13%
jan 1, 2004
313.281 mln
-36.024 mln
-10.31%
jan 1, 2005
539.815 mln
+226.534 mln
72.31%
jan 1, 2006
837.212 mln
+297.397 mln
55.09%
jan 1, 2007
549.837 mln
-287.375 mln
-34.33%
jan 1, 2008
919.784 mln
+369.947 mln
67.28%
jan 1, 2009
1.706 bln
+786.334 mln
85.49%
jan 1, 2010
1.701 bln
-4.824 mln
-0.28%
jan 1, 2011
2.047 bln
+345.566 mln
20.31%
jan 1, 2012
2.186 bln
+138.806 mln
6.78%
jan 1, 2013
2.033 bln
-152.526 mln
-6.98%
jan 1, 2014
2.076 bln
+43.176 mln
2.12%
jan 1, 2015
2.085 bln
+8.991 mln
0.43%
jan 1, 2016
1.504 bln
-581.789 mln
-27.9%
Ranking of countries by current statistics by years


Comments: