29
/
en
AIzaSyAYiBZKx7MnpbEhh9jyipgxe19OcubqV5w
April 1, 2024
238086
Seychelles
SYC
true
2
1
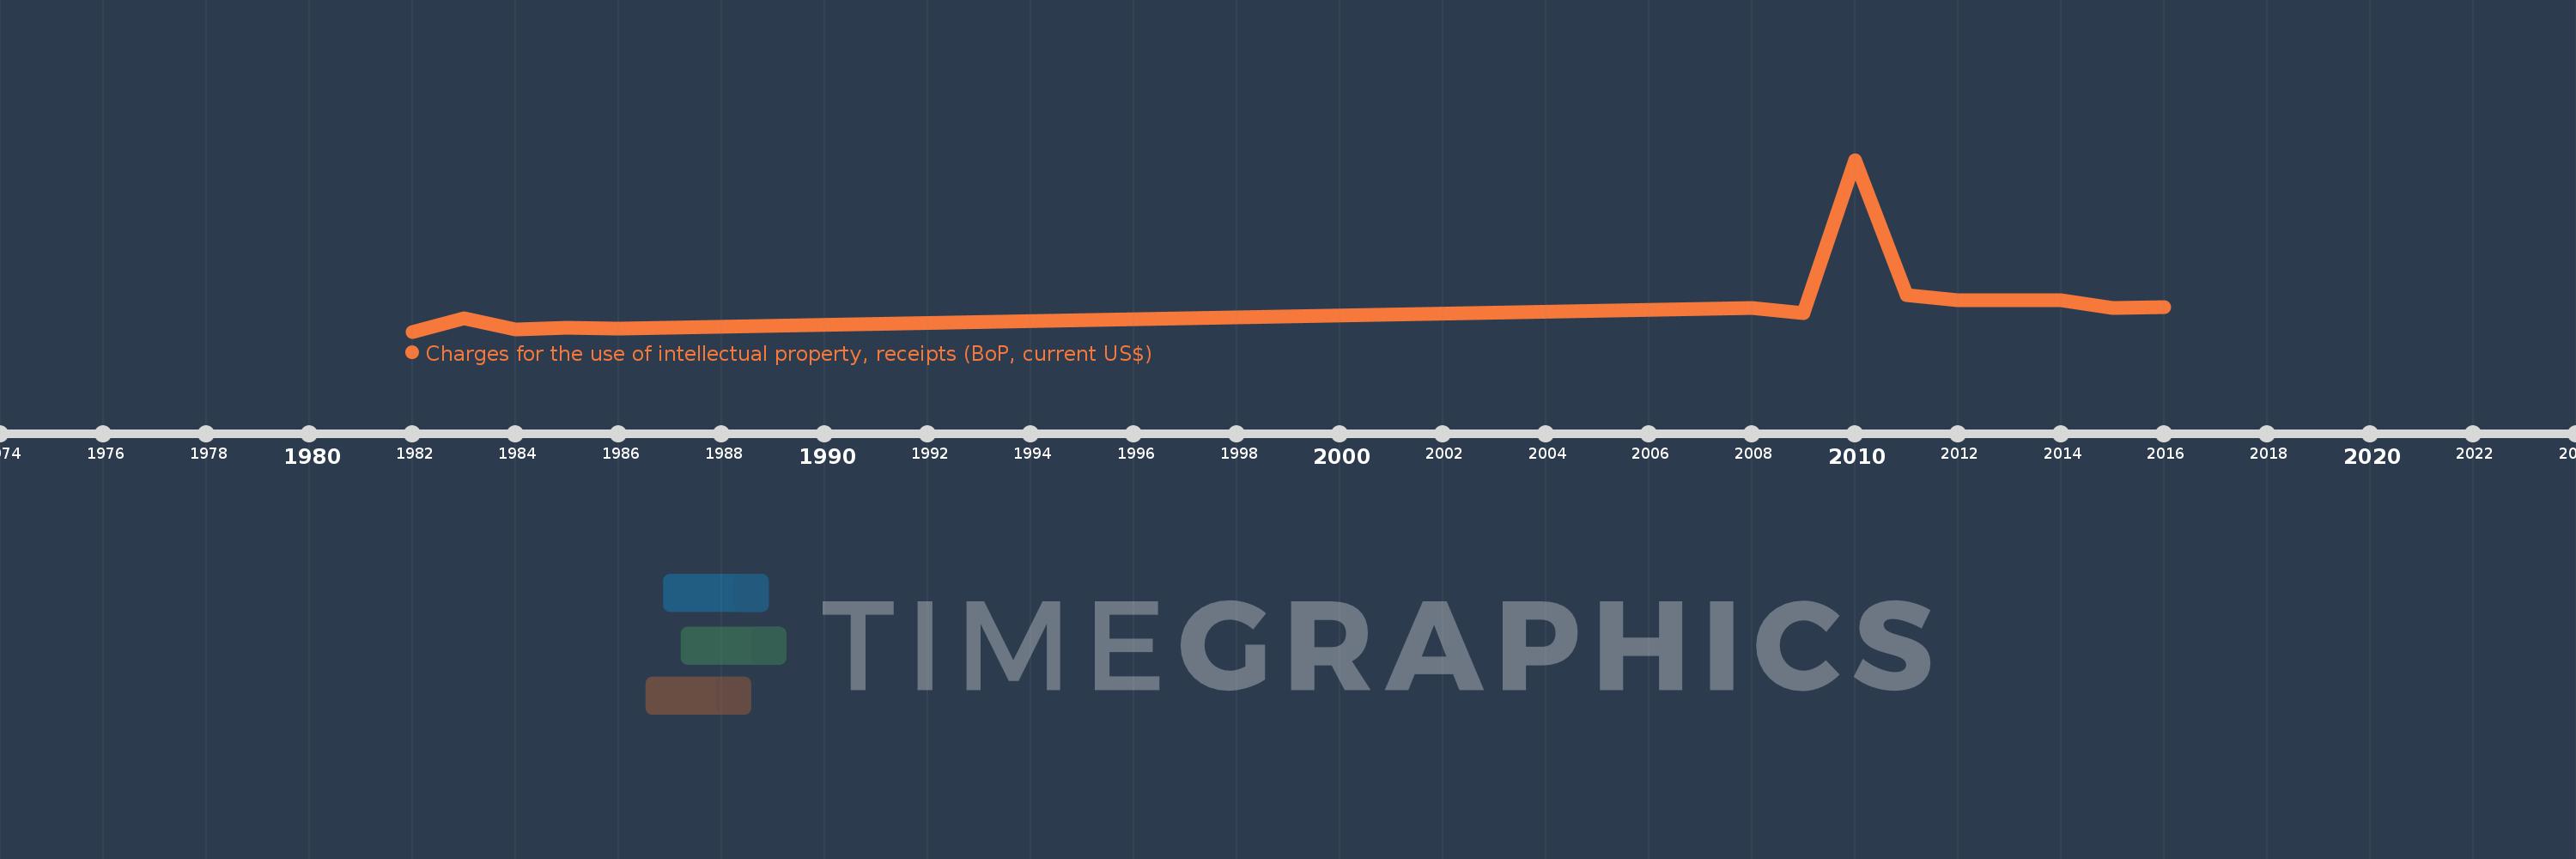
Charges for the use of intellectual property, receipts (BoP, current US$)
2016,2015,2014,2013,2012,2011,2010,2009,2008,1986,1985,1984,1983,1982
This statistics in other country:
Timeline:
This timeline shows a graph from 1982 to 2016 of Seychelles. No data until 1981. Number of actual observations by date: 14.
Source name:
World Development Indicators
Source organization:
International Monetary Fund, Balance of Payments Statistics Yearbook and data files.
Categories, topics:
Economy & Growth, Science & Technology
Last updated:
apr 23, 2017
Indicators value changes by year
Minimum:
47.332K
jan 1, 1982
Maximum:
8.667 mln
jan 1, 2010
At the date of observation
Value
Absolute change
Change from previous value
jan 1, 1982
47.332K
+47.332K
0.0%
jan 1, 1983
731.489K
+684.157K
1.45K%
jan 1, 1984
163.906K
-567.584K
-77.59%
jan 1, 1985
237.289K
+73.383K
44.77%
jan 1, 1986
183.374K
-53.914K
-22.72%
jan 1, 2008
1.223 mln
+1.039 mln
566.82%
jan 1, 2009
994.458K
-228.324K
-18.67%
jan 1, 2010
8.667 mln
+7.672 mln
771.48%
jan 1, 2011
1.865 mln
-6.802 mln
-78.48%
jan 1, 2012
1.609 mln
-255.739K
-13.72%
jan 1, 2013
1.61 mln
+609.217
0.04%
jan 1, 2014
1.641 mln
+31.564K
1.96%
jan 1, 2015
1.241 mln
-400.454K
-24.4%
jan 1, 2016
1.272 mln
+31.345K
2.53%
Ranking of countries by current statistics by years


Comments: