29
/
en
AIzaSyAYiBZKx7MnpbEhh9jyipgxe19OcubqV5w
April 1, 2024
104622
Chile
CHL
true
2
1
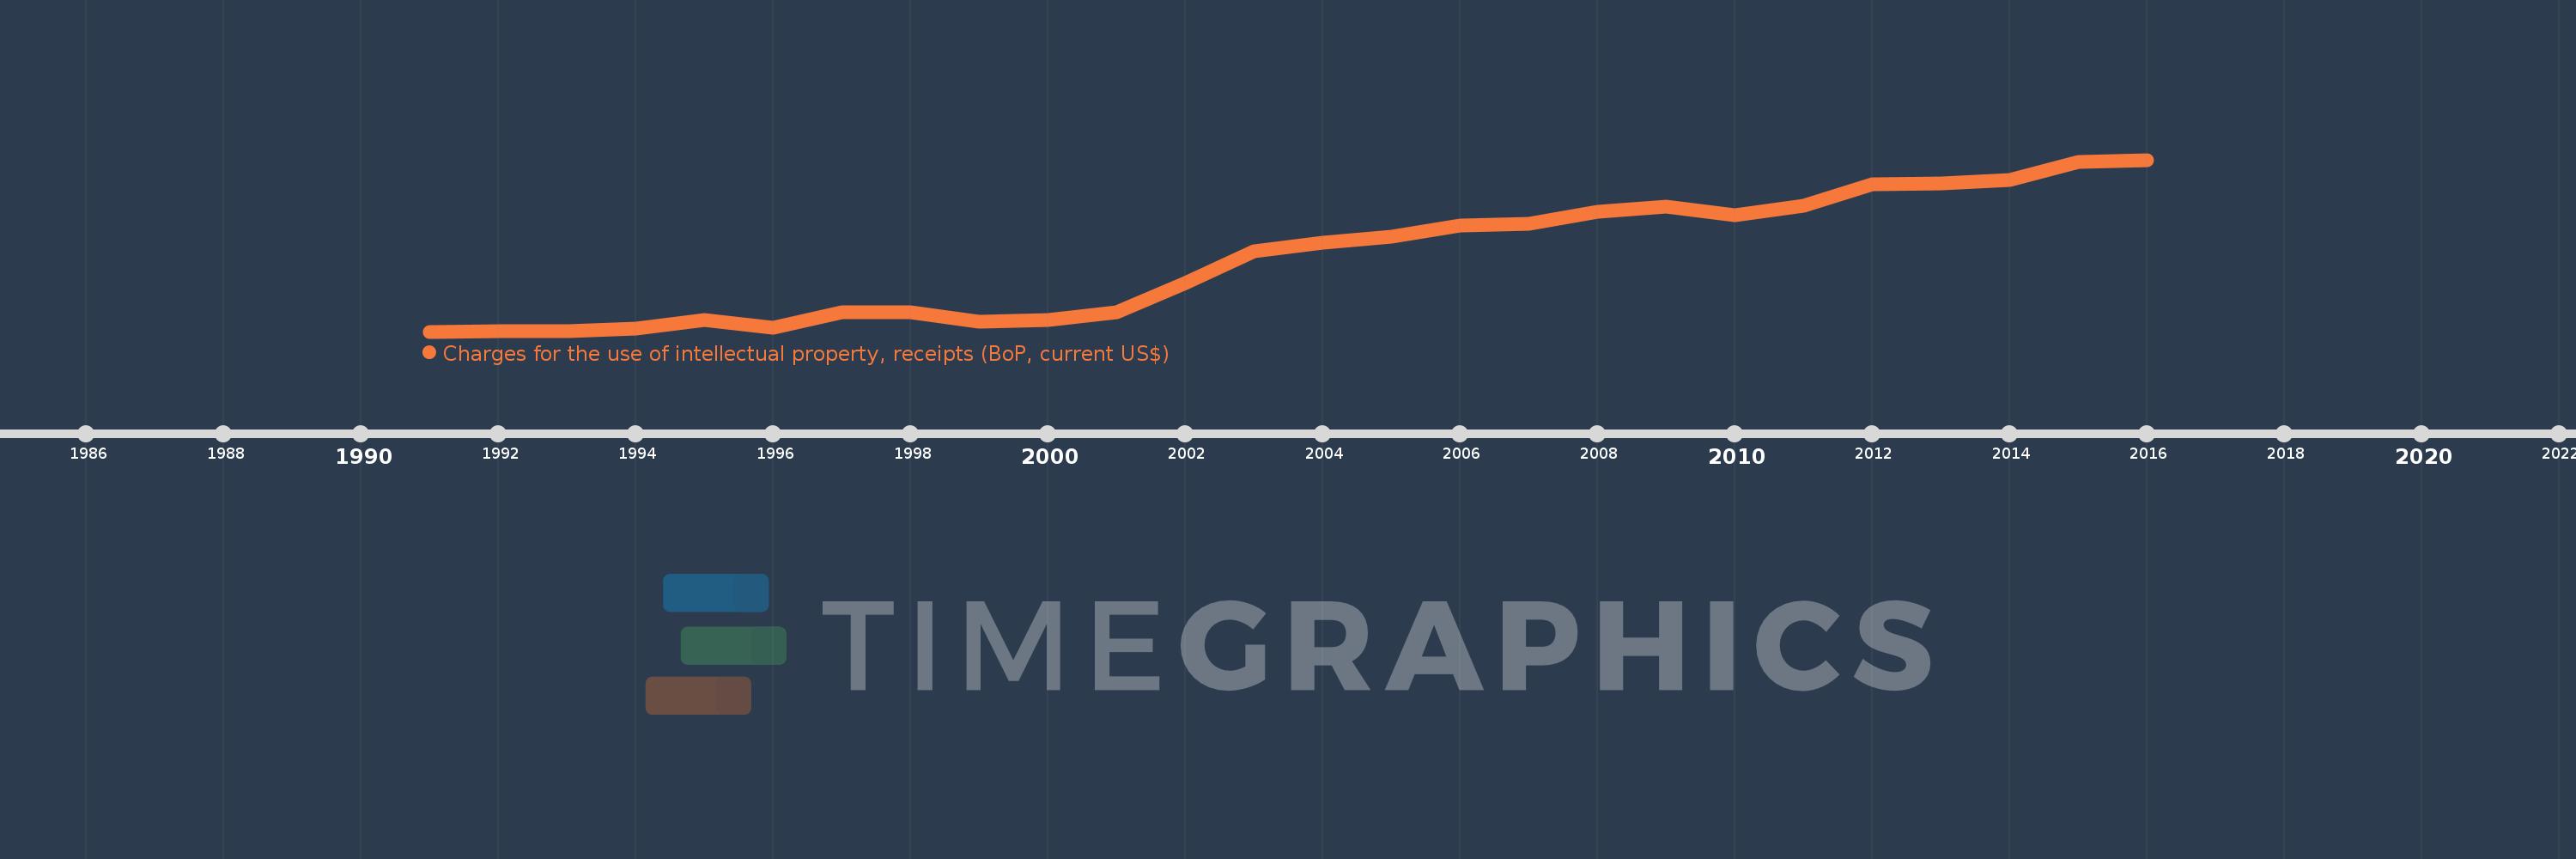
Charges for the use of intellectual property, receipts (BoP, current US$)
2016,2015,2014,2013,2012,2011,2010,2009,2008,2007,2006,2005,2004,2003,2002,2001,2000,1999,1998,1997,1996,1995,1994,1993,1992,1991
This statistics in other country:
Timeline:
This timeline shows a graph from 1991 to 2016 of Chile. No data until 1990. Number of actual observations by date: 26.
Source name:
World Development Indicators
Source organization:
International Monetary Fund, Balance of Payments Statistics Yearbook and data files.
Categories, topics:
Economy & Growth, Science & Technology
Last updated:
apr 23, 2017
Indicators value changes by year
Minimum:
100.0K
jan 1, 1991
Maximum:
87.578 mln
jan 1, 2016
At the date of observation
Value
Absolute change
Change from previous value
jan 1, 1991
100.0K
+100.0K
0.0%
jan 1, 1992
500.0K
+400.0K
400.0%
jan 1, 1993
500.0K
0.0
0.0%
jan 1, 1994
1.7 mln
+1.2 mln
240.0%
jan 1, 1995
6.0 mln
+4.3 mln
252.94%
jan 1, 1996
1.9 mln
-4.1 mln
-68.33%
jan 1, 1997
10.1 mln
+8.2 mln
431.58%
jan 1, 1998
10.0 mln
-100.0K
-0.99%
jan 1, 1999
5.1 mln
-4.9 mln
-49.0%
jan 1, 2000
6.0 mln
+900.0K
17.65%
jan 1, 2001
10.0 mln
+4.0 mln
66.67%
jan 1, 2002
24.903 mln
+14.903 mln
149.03%
jan 1, 2003
41.1 mln
+16.197 mln
65.04%
jan 1, 2004
45.451 mln
+4.351 mln
10.59%
jan 1, 2005
48.456 mln
+3.005 mln
6.61%
jan 1, 2006
54.0 mln
+5.544 mln
11.44%
jan 1, 2007
55.2 mln
+1.2 mln
2.22%
jan 1, 2008
61.289 mln
+6.089 mln
11.03%
jan 1, 2009
63.623 mln
+2.335 mln
3.81%
jan 1, 2010
59.161 mln
-4.462 mln
-7.01%
jan 1, 2011
64.09 mln
+4.929 mln
8.33%
jan 1, 2012
75.247 mln
+11.157 mln
17.41%
jan 1, 2013
75.409 mln
+161.207K
0.21%
jan 1, 2014
77.139 mln
+1.731 mln
2.3%
jan 1, 2015
86.344 mln
+9.204 mln
11.93%
jan 1, 2016
87.578 mln
+1.234 mln
1.43%
Ranking of countries by current statistics by years


Comments: