29
/
en
AIzaSyAYiBZKx7MnpbEhh9jyipgxe19OcubqV5w
April 1, 2024
53253
Other small states
OSS
false
2
1
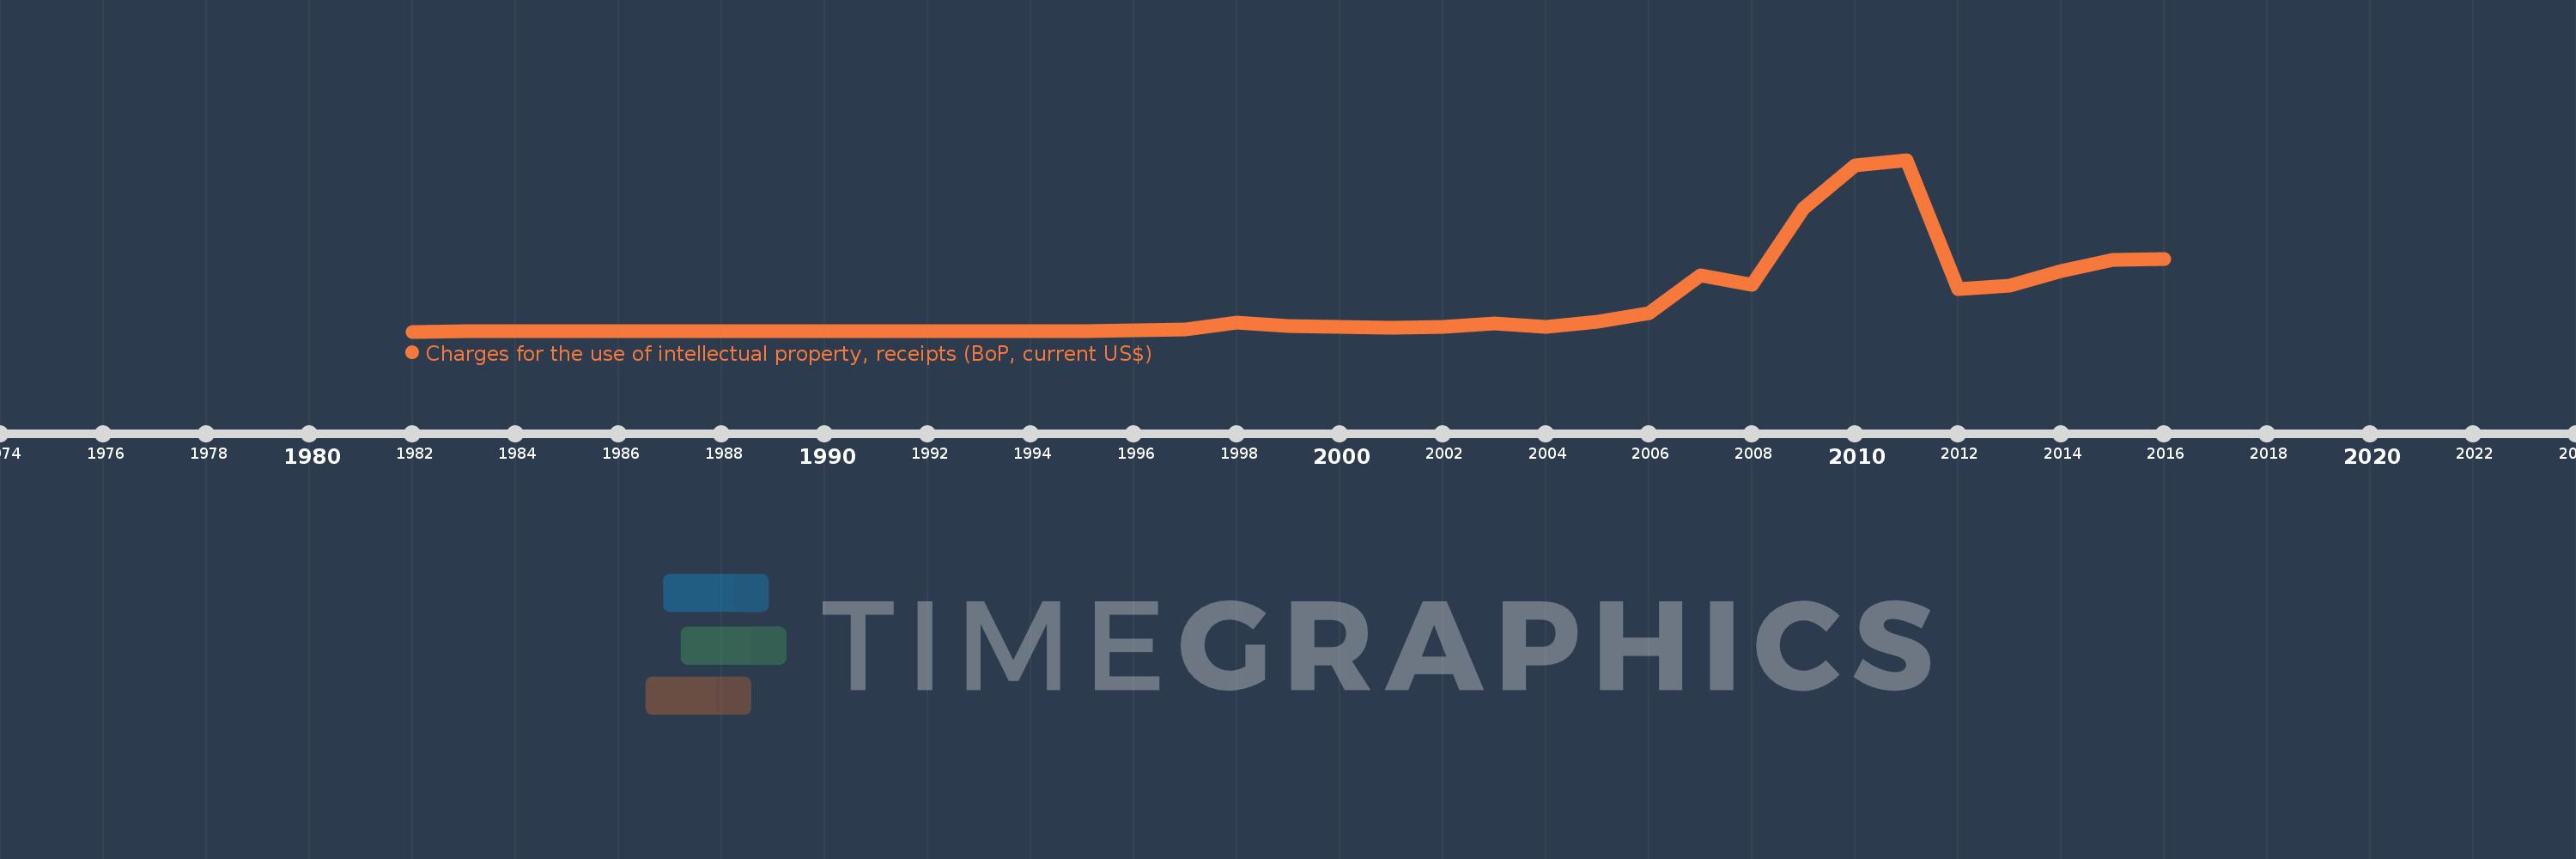
Charges for the use of intellectual property, receipts (BoP, current US$)
2016,2015,2014,2013,2012,2011,2010,2009,2008,2007,2006,2005,2004,2003,2002,2001,2000,1999,1998,1997,1996,1995,1994,1993,1992,1991,1990,1989,1988,1987,1986,1985,1984,1983,1982
This statistics in other country:
Timeline:
This timeline shows a graph from 1982 to 2016 of Other small states. No data until 1981. Number of actual observations by date: 35.
Source name:
World Development Indicators
Source organization:
International Monetary Fund, Balance of Payments Statistics Yearbook and data files.
Categories, topics:
Economy & Growth, Science & Technology
Last updated:
apr 23, 2017
Indicators value changes by year
Minimum:
47.332K
jan 1, 1982
Maximum:
1.246 bln
jan 1, 2011
At the date of observation
Value
Absolute change
Change from previous value
jan 1, 1982
47.332K
+47.332K
0.0%
jan 1, 1983
731.489K
+684.157K
1.45K%
jan 1, 1984
163.906K
-567.584K
-77.59%
jan 1, 1985
237.289K
+73.383K
44.77%
jan 1, 1986
183.374K
-53.914K
-22.72%
jan 1, 1987
554.458K
+371.083K
202.36%
jan 1, 1988
400.0K
-154.458K
-27.86%
jan 1, 1989
3.791 mln
+3.391 mln
847.87%
jan 1, 1990
1.287 mln
-2.505 mln
-66.06%
jan 1, 1991
3.138 mln
+1.851 mln
143.86%
jan 1, 1992
1.778 mln
-1.36 mln
-43.33%
jan 1, 1993
5.122 mln
+3.344 mln
188.03%
jan 1, 1994
1.846 mln
-3.276 mln
-63.96%
jan 1, 1995
3.27 mln
+1.424 mln
77.13%
jan 1, 1996
6.453 mln
+3.183 mln
97.33%
jan 1, 1997
16.807 mln
+10.354 mln
160.45%
jan 1, 1998
65.043 mln
+48.236 mln
286.99%
jan 1, 1999
43.161 mln
-21.882 mln
-33.64%
jan 1, 2000
35.762 mln
-7.399 mln
-17.14%
jan 1, 2001
28.63 mln
-7.133 mln
-19.94%
jan 1, 2002
37.172 mln
+8.542 mln
29.84%
jan 1, 2003
58.811 mln
+21.639 mln
58.21%
jan 1, 2004
32.497 mln
-26.314 mln
-44.74%
jan 1, 2005
68.828 mln
+36.331 mln
111.8%
jan 1, 2006
135.066 mln
+66.238 mln
96.24%
jan 1, 2007
407.66 mln
+272.595 mln
201.82%
jan 1, 2008
340.709 mln
-66.952 mln
-16.42%
jan 1, 2009
891.416 mln
+550.707 mln
161.64%
jan 1, 2010
1.205 bln
+313.529 mln
35.17%
jan 1, 2011
1.246 bln
+41.55 mln
3.45%
jan 1, 2012
310.074 mln
-936.42 mln
-75.12%
jan 1, 2013
333.165 mln
+23.09 mln
7.45%
jan 1, 2014
441.92 mln
+108.756 mln
32.64%
jan 1, 2015
521.393 mln
+79.472 mln
17.98%
jan 1, 2016
526.061 mln
+4.668 mln
0.9%
Ranking of countries by current statistics by years


Comments: