29
/
en
AIzaSyAYiBZKx7MnpbEhh9jyipgxe19OcubqV5w
April 1, 2024
224618
Poland
POL
true
2
1
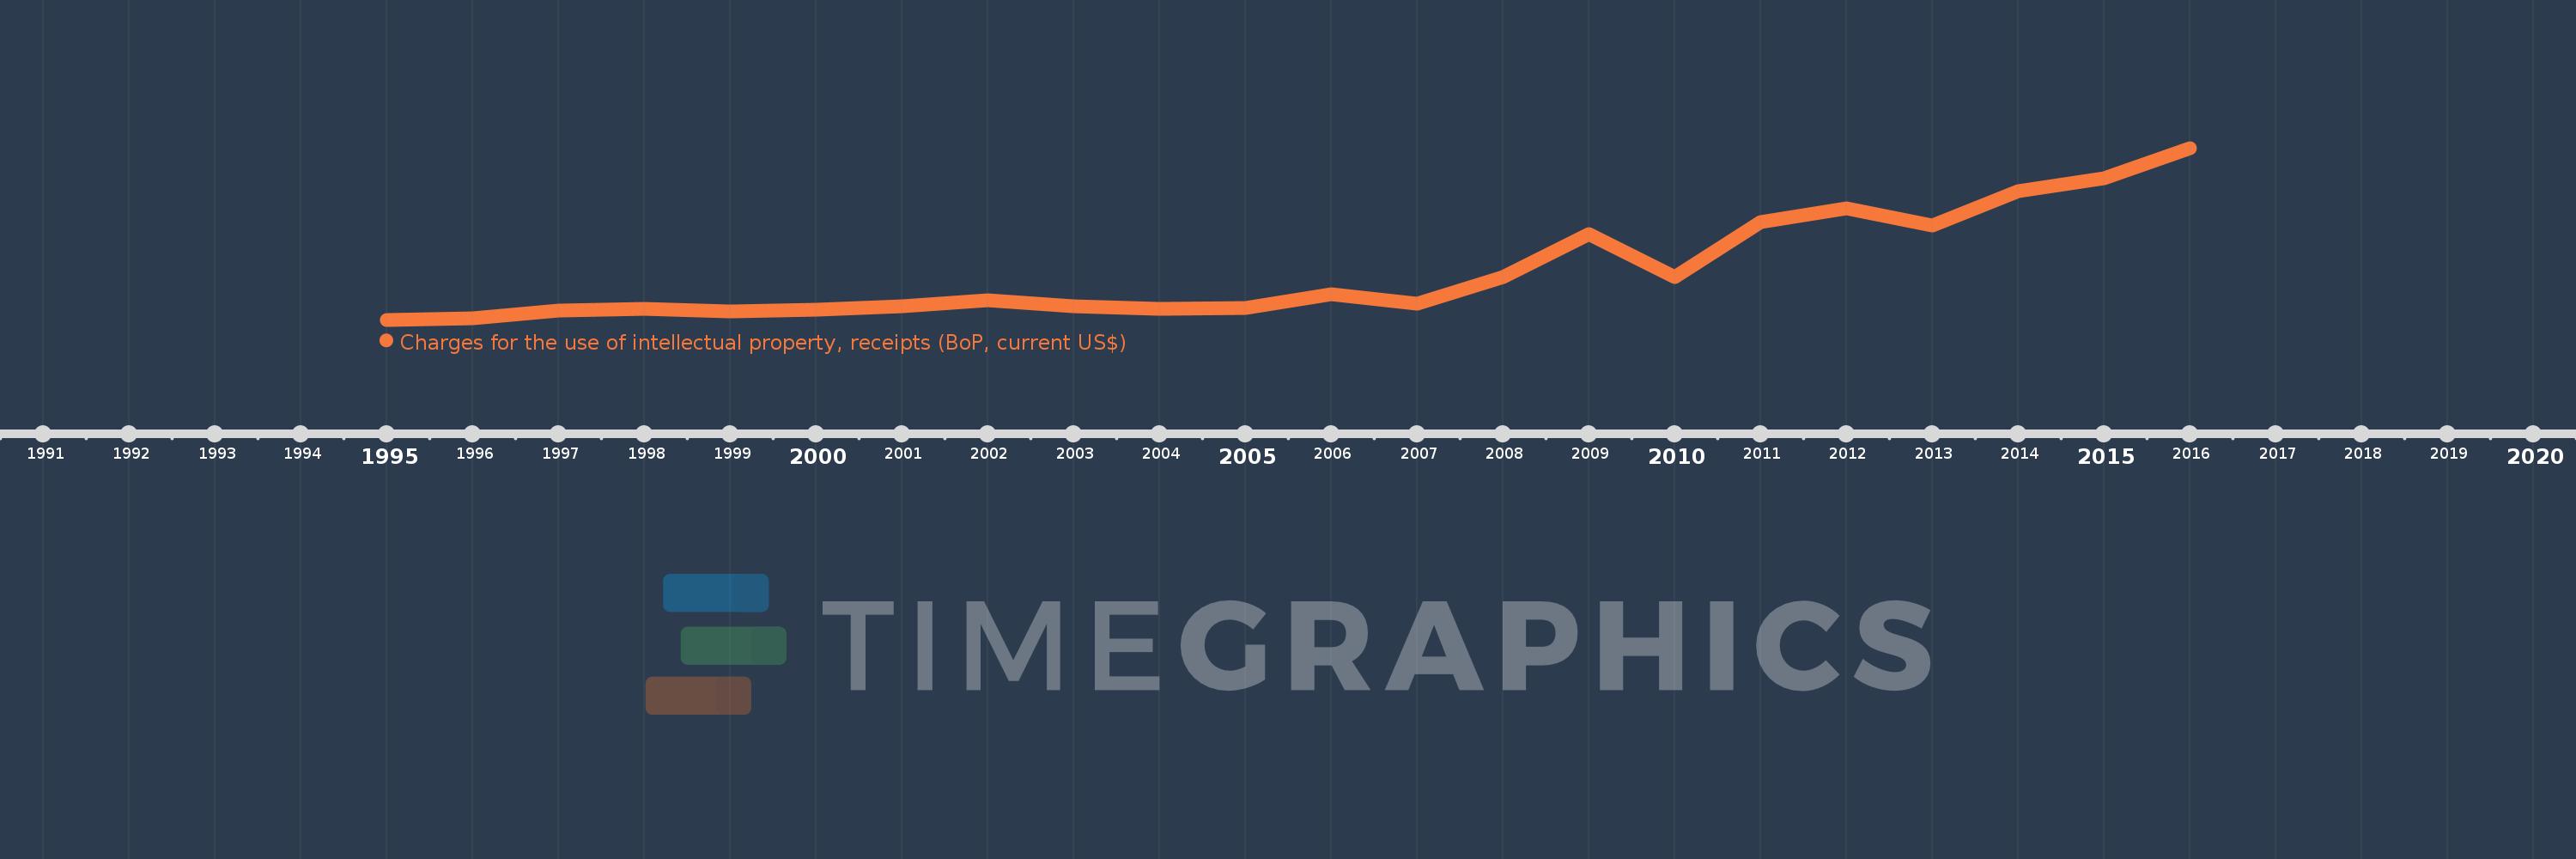
Charges for the use of intellectual property, receipts (BoP, current US$)
2016,2015,2014,2013,2012,2011,2010,2009,2008,2007,2006,2005,2004,2003,2002,2001,2000,1999,1998,1997,1996,1995
This statistics in other country:
Timeline:
This timeline shows a graph from 1995 to 2016 of Poland. No data until 1994. Number of actual observations by date: 22.
Source name:
World Development Indicators
Source organization:
International Monetary Fund, Balance of Payments Statistics Yearbook and data files.
Categories, topics:
Economy & Growth, Science & Technology
Last updated:
apr 23, 2017
Indicators value changes by year
Minimum:
1000.0K
jan 1, 1995
Maximum:
415.0 mln
jan 1, 2016
At the date of observation
Value
Absolute change
Change from previous value
jan 1, 1995
1000.0K
+1000.0K
0.0%
jan 1, 1996
4.0 mln
+3.0 mln
300.0%
jan 1, 1997
24.0 mln
+20.0 mln
500.0%
jan 1, 1998
27.0 mln
+3.0 mln
12.5%
jan 1, 1999
22.0 mln
-5.0 mln
-18.52%
jan 1, 2000
25.0 mln
+3.0 mln
13.64%
jan 1, 2001
34.0 mln
+9.0 mln
36.0%
jan 1, 2002
48.0 mln
+14.0 mln
41.18%
jan 1, 2003
34.0 mln
-14.0 mln
-29.17%
jan 1, 2004
28.0 mln
-6.0 mln
-17.65%
jan 1, 2005
30.0 mln
+2.0 mln
7.14%
jan 1, 2006
62.0 mln
+32.0 mln
106.67%
jan 1, 2007
39.0 mln
-23.0 mln
-37.1%
jan 1, 2008
103.0 mln
+64.0 mln
164.1%
jan 1, 2009
207.0 mln
+104.0 mln
100.97%
jan 1, 2010
103.0 mln
-104.0 mln
-50.24%
jan 1, 2011
237.0 mln
+134.0 mln
130.1%
jan 1, 2012
270.0 mln
+33.0 mln
13.92%
jan 1, 2013
229.0 mln
-41.0 mln
-15.19%
jan 1, 2014
311.0 mln
+82.0 mln
35.81%
jan 1, 2015
342.0 mln
+31.0 mln
9.97%
jan 1, 2016
415.0 mln
+73.0 mln
21.35%
Ranking of countries by current statistics by years


Comments: