29
/
en
AIzaSyAYiBZKx7MnpbEhh9jyipgxe19OcubqV5w
April 1, 2024
54603
Post-demographic dividend
PST
false
2
1
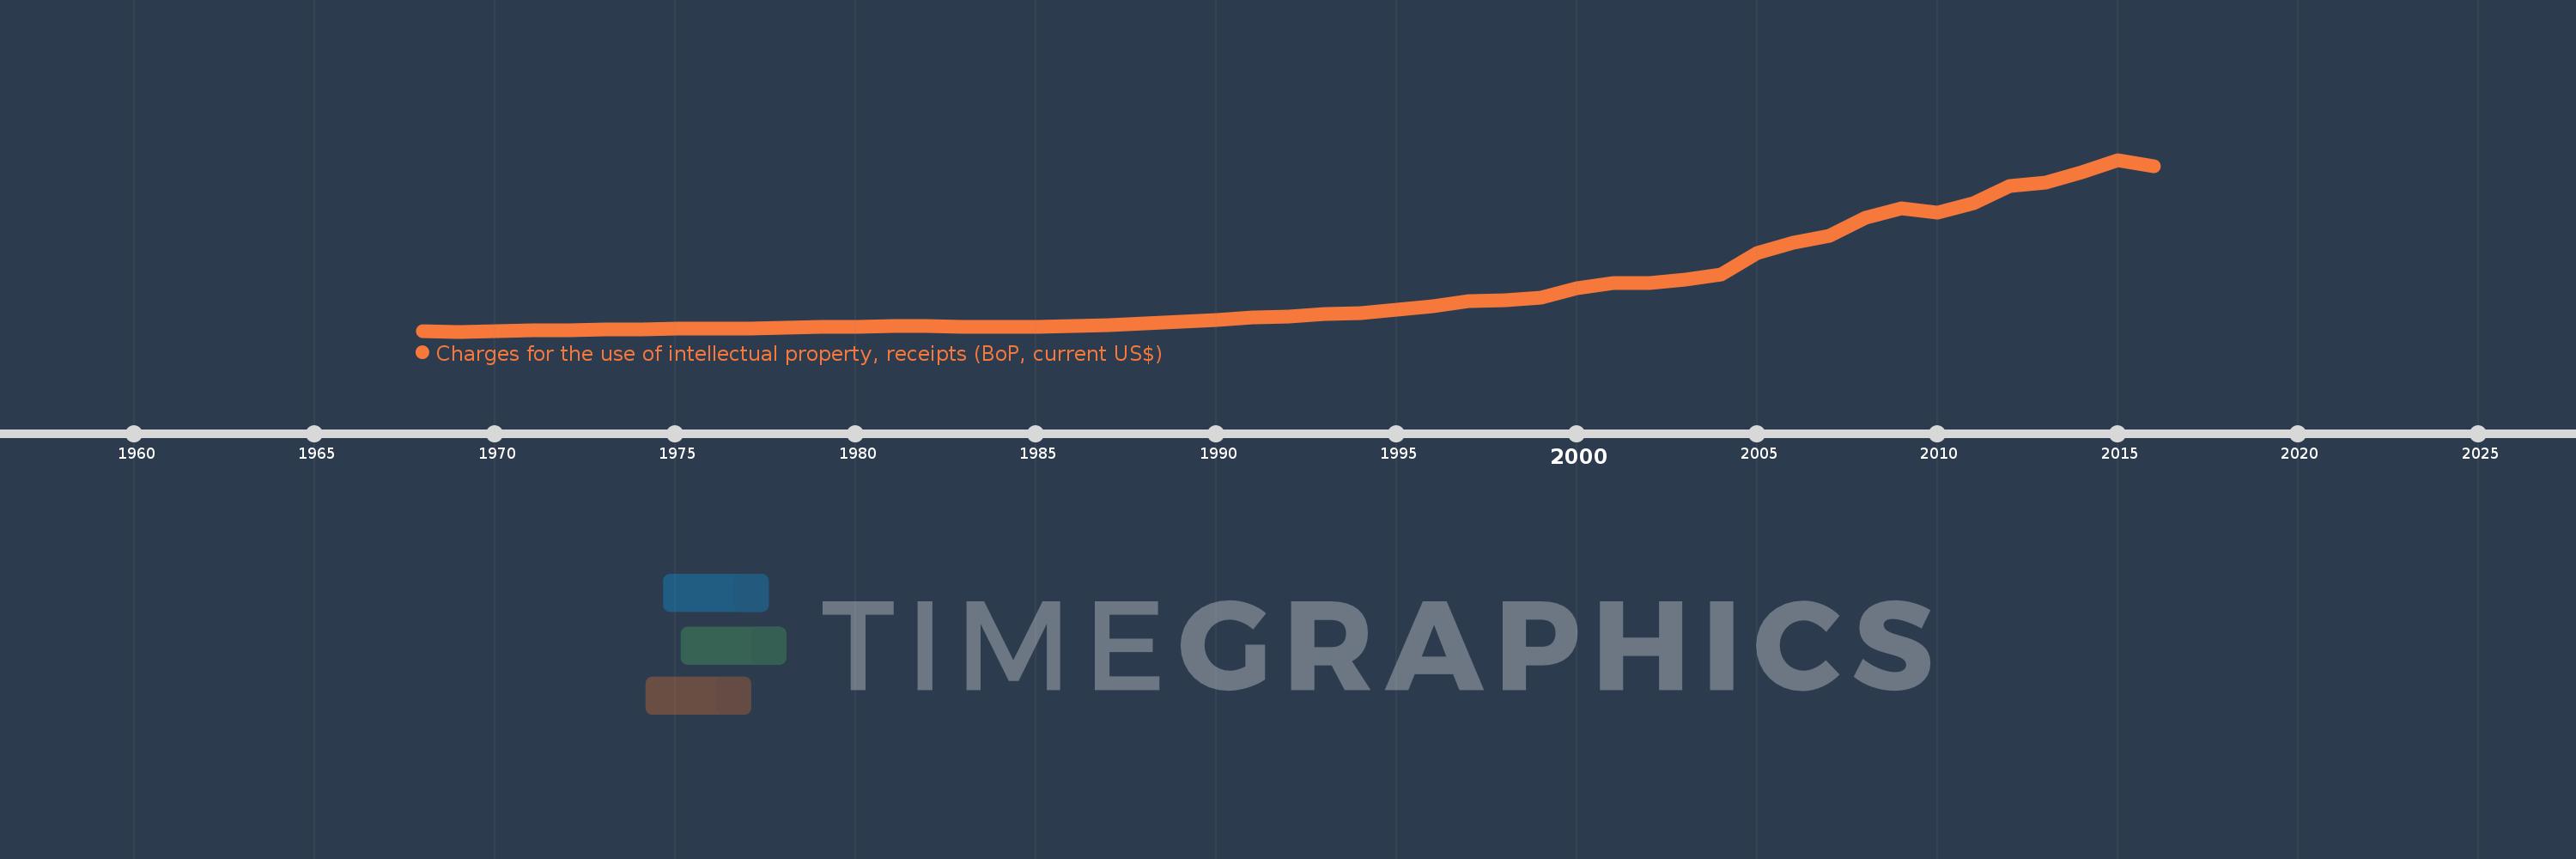
Charges for the use of intellectual property, receipts (BoP, current US$)
2016,2015,2014,2013,2012,2011,2010,2009,2008,2007,2006,2005,2004,2003,2002,2001,2000,1999,1998,1997,1996,1995,1994,1993,1992,1991,1990,1989,1988,1987,1986,1985,1984,1983,1982,1981,1980,1979,1978,1977,1976,1975,1974,1973,1972,1971,1970,1969,1968
This statistics in other country:
Timeline:
This timeline shows a graph from 1968 to 2016 of Post-demographic dividend. No data until 1967. Number of actual observations by date: 49.
Source name:
World Development Indicators
Source organization:
International Monetary Fund, Balance of Payments Statistics Yearbook and data files.
Categories, topics:
Economy & Growth, Science & Technology
Last updated:
apr 23, 2017
Indicators value changes by year
Minimum:
58.84 mln
jan 1, 1969
Maximum:
316.951 bln
jan 1, 2015
At the date of observation
Value
Absolute change
Change from previous value
jan 1, 1968
64.641 mln
+64.641 mln
0.0%
jan 1, 1969
58.84 mln
-5.801 mln
-8.97%
jan 1, 1970
82.873 mln
+24.033 mln
40.85%
jan 1, 1971
2.788 bln
+2.705 bln
3.26K%
jan 1, 1972
3.19 bln
+402.612 mln
14.44%
jan 1, 1973
3.535 bln
+345.143 mln
10.82%
jan 1, 1974
4.136 bln
+600.425 mln
16.98%
jan 1, 1975
4.878 bln
+742.539 mln
17.95%
jan 1, 1976
5.727 bln
+848.344 mln
17.39%
jan 1, 1977
5.923 bln
+196.283 mln
3.43%
jan 1, 1978
6.693 bln
+770.455 mln
13.01%
jan 1, 1979
8.048 bln
+1.354 bln
20.23%
jan 1, 1980
8.788 bln
+740.365 mln
9.2%
jan 1, 1981
10.078 bln
+1.29 bln
14.68%
jan 1, 1982
10.208 bln
+129.663 mln
1.29%
jan 1, 1983
8.137 bln
-2.071 bln
-20.29%
jan 1, 1984
8.714 bln
+576.633 mln
7.09%
jan 1, 1985
8.791 bln
+77.674 mln
0.89%
jan 1, 1986
9.583 bln
+791.413 mln
9.0%
jan 1, 1987
11.795 bln
+2.212 bln
23.08%
jan 1, 1988
15.57 bln
+3.776 bln
32.01%
jan 1, 1989
18.561 bln
+2.991 bln
19.21%
jan 1, 1990
20.794 bln
+2.233 bln
12.03%
jan 1, 1991
26.438 bln
+5.644 bln
27.14%
jan 1, 1992
27.672 bln
+1.234 bln
4.67%
jan 1, 1993
32.169 bln
+4.497 bln
16.25%
jan 1, 1994
33.614 bln
+1.446 bln
4.49%
jan 1, 1995
40.843 bln
+7.228 bln
21.5%
jan 1, 1996
46.42 bln
+5.578 bln
13.66%
jan 1, 1997
56.298 bln
+9.878 bln
21.28%
jan 1, 1998
58.21 bln
+1.911 bln
3.4%
jan 1, 1999
62.584 bln
+4.374 bln
7.51%
jan 1, 2000
80.434 bln
+17.85 bln
28.52%
jan 1, 2001
90.002 bln
+9.569 bln
11.9%
jan 1, 2002
89.172 bln
-830.711 mln
-0.92%
jan 1, 2003
96.529 bln
+7.357 bln
8.25%
jan 1, 2004
106.053 bln
+9.524 bln
9.87%
jan 1, 2005
144.374 bln
+38.321 bln
36.13%
jan 1, 2006
163.734 bln
+19.36 bln
13.41%
jan 1, 2007
176.715 bln
+12.981 bln
7.93%
jan 1, 2008
209.233 bln
+32.518 bln
18.4%
jan 1, 2009
228.01 bln
+18.777 bln
8.97%
jan 1, 2010
219.538 bln
-8.472 bln
-3.72%
jan 1, 2011
237.239 bln
+17.701 bln
8.06%
jan 1, 2012
268.126 bln
+30.887 bln
13.02%
jan 1, 2013
275.532 bln
+7.406 bln
2.76%
jan 1, 2014
293.602 bln
+18.07 bln
6.56%
jan 1, 2015
316.951 bln
+23.349 bln
7.95%
jan 1, 2016
305.216 bln
-11.735 bln
-3.7%
Ranking of countries by current statistics by years


Comments: