29
/
en
AIzaSyAYiBZKx7MnpbEhh9jyipgxe19OcubqV5w
April 1, 2024
134779
French Polynesia
PYF
true
2
1
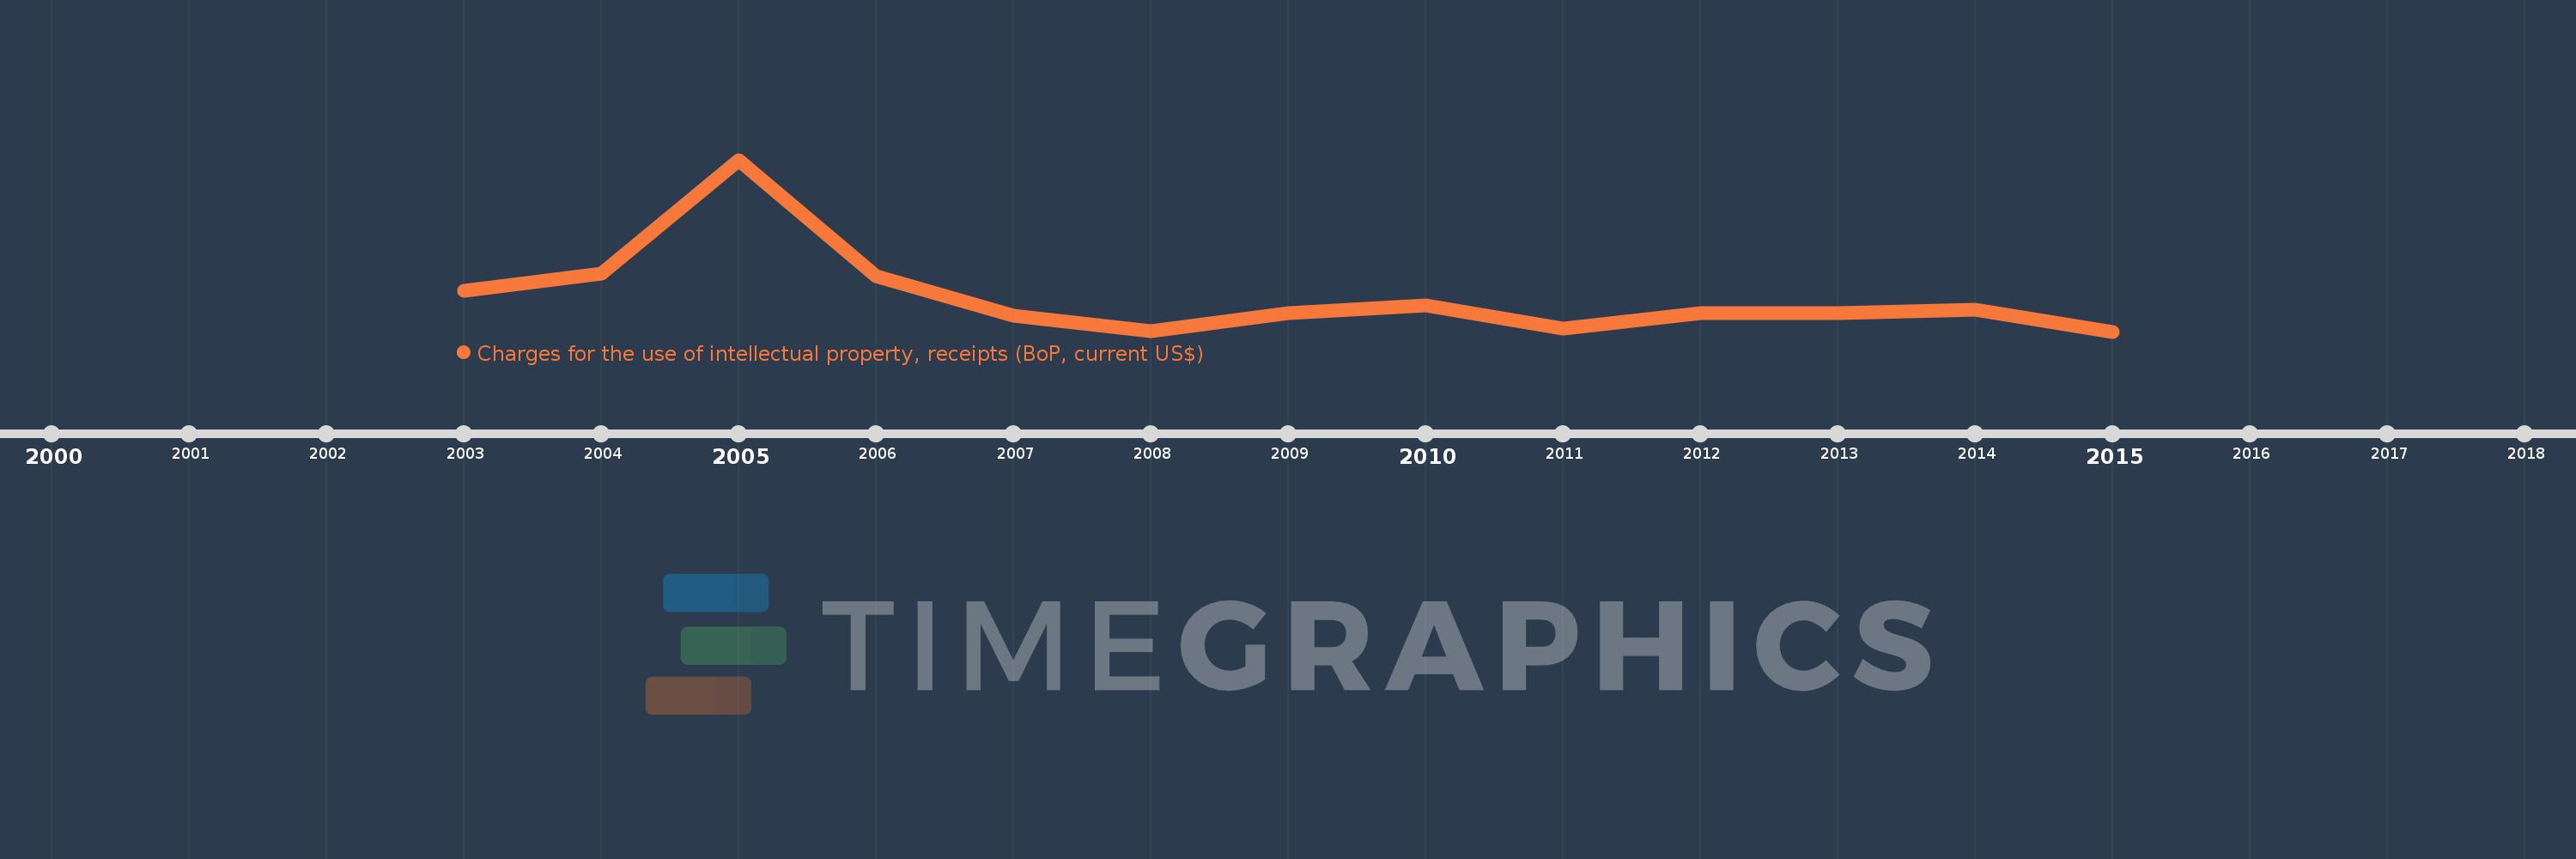
Charges for the use of intellectual property, receipts (BoP, current US$)
2015,2014,2013,2012,2011,2010,2009,2008,2007,2006,2005,2004,2003
This statistics in other country:
Timeline:
This timeline shows a graph from 2003 to 2015 of French Polynesia. No data until 2002. Number of actual observations by date: 13.
Source name:
World Development Indicators
Source organization:
International Monetary Fund, Balance of Payments Statistics Yearbook and data files.
Categories, topics:
Economy & Growth, Science & Technology
Last updated:
apr 23, 2017
Indicators value changes by year
Minimum:
175.596K
jan 1, 2015
Maximum:
1.228 mln
jan 1, 2005
At the date of observation
Value
Absolute change
Change from previous value
jan 1, 2003
425.881K
+425.881K
0.0%
jan 1, 2004
529.641K
+103.761K
24.36%
jan 1, 2005
1.228 mln
+698.175K
131.82%
jan 1, 2006
515.992K
-711.825K
-57.97%
jan 1, 2007
271.362K
-244.63K
-47.41%
jan 1, 2008
178.321K
-93.04K
-34.29%
jan 1, 2009
288.697K
+110.376K
61.9%
jan 1, 2010
334.386K
+45.689K
15.83%
jan 1, 2011
196.114K
-138.272K
-41.35%
jan 1, 2012
291.233K
+95.119K
48.5%
jan 1, 2013
290.26K
-972.872
-0.33%
jan 1, 2014
309.18K
+18.92K
6.52%
jan 1, 2015
175.596K
-133.584K
-43.21%
Ranking of countries by current statistics by years


Comments: