29
/
en
AIzaSyAYiBZKx7MnpbEhh9jyipgxe19OcubqV5w
April 1, 2024
27916
East Asia & Pacific (excluding high income)
EAP
false
2
1
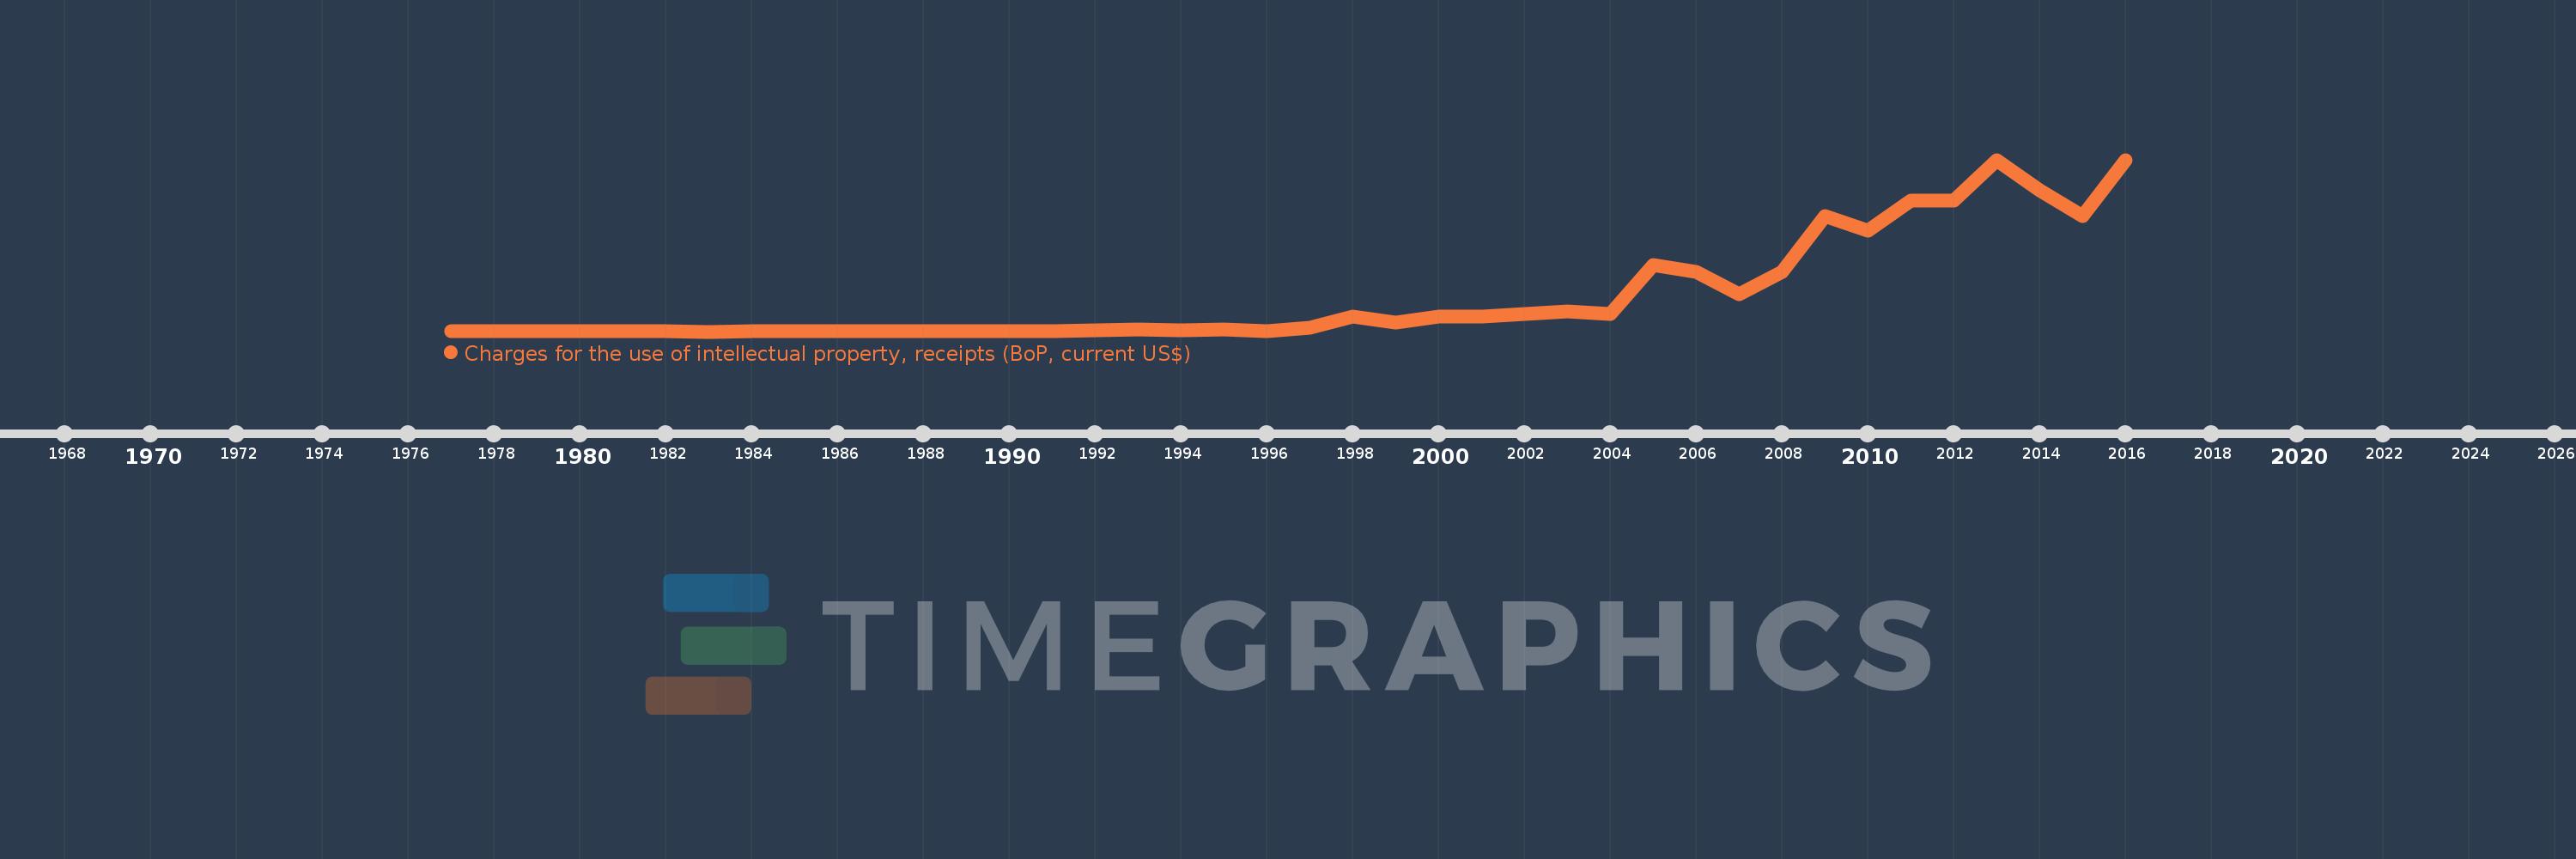
Charges for the use of intellectual property, receipts (BoP, current US$)
2016,2015,2014,2013,2012,2011,2010,2009,2008,2007,2006,2005,2004,2003,2002,2001,2000,1999,1998,1997,1996,1995,1994,1993,1992,1991,1990,1989,1988,1987,1986,1985,1984,1983,1982,1981,1980,1978,1977
This statistics in other country:
Timeline:
This timeline shows a graph from 1977 to 2016 of East Asia & Pacific (excluding high income). No data until 1976. Number of actual observations by date: 39.
Source name:
World Development Indicators
Source organization:
International Monetary Fund, Balance of Payments Statistics Yearbook and data files.
Categories, topics:
Economy & Growth, Science & Technology
Last updated:
apr 23, 2017
Indicators value changes by year
Minimum:
456.0K
jan 1, 1983
Maximum:
1.356 bln
jan 1, 2013
At the date of observation
Value
Absolute change
Change from previous value
jan 1, 1977
3.588 mln
+3.588 mln
0.0%
jan 1, 1978
839.59K
-2.748 mln
-76.6%
jan 1, 1980
532.748K
-306.842K
-36.55%
jan 1, 1981
657.828K
+125.08K
23.48%
jan 1, 1982
1.28 mln
+621.762K
94.52%
jan 1, 1983
456.0K
-823.59K
-64.36%
jan 1, 1984
1.743 mln
+1.287 mln
282.29%
jan 1, 1985
772.286K
-970.936K
-55.7%
jan 1, 1986
3.91 mln
+3.138 mln
406.34%
jan 1, 1987
2.666 mln
-1.245 mln
-31.83%
jan 1, 1988
2.018 mln
-647.498K
-24.29%
jan 1, 1989
2.532 mln
+514.027K
25.47%
jan 1, 1990
2.587 mln
+54.552K
2.15%
jan 1, 1991
4.319 mln
+1.732 mln
66.95%
jan 1, 1992
11.622 mln
+7.304 mln
169.11%
jan 1, 1993
19.114 mln
+7.492 mln
64.46%
jan 1, 1994
12.423 mln
-6.692 mln
-35.01%
jan 1, 1995
17.692 mln
+5.269 mln
42.41%
jan 1, 1996
2.599 mln
-15.092 mln
-85.31%
jan 1, 1997
30.131 mln
+27.532 mln
1.06K%
jan 1, 1998
117.114 mln
+86.982 mln
288.68%
jan 1, 1999
70.209 mln
-46.904 mln
-40.05%
jan 1, 2000
117.074 mln
+46.864 mln
66.75%
jan 1, 2001
117.425 mln
+351.191K
0.3%
jan 1, 2002
141.994 mln
+24.569 mln
20.92%
jan 1, 2003
157.295 mln
+15.301 mln
10.78%
jan 1, 2004
140.412 mln
-16.883 mln
-10.73%
jan 1, 2005
524.804 mln
+384.392 mln
273.76%
jan 1, 2006
470.53 mln
-54.274 mln
-10.34%
jan 1, 2007
297.292 mln
-173.238 mln
-36.82%
jan 1, 2008
470.305 mln
+173.013 mln
58.2%
jan 1, 2009
913.943 mln
+443.638 mln
94.33%
jan 1, 2010
800.047 mln
-113.896 mln
-12.46%
jan 1, 2011
1.032 bln
+231.871 mln
28.98%
jan 1, 2012
1.037 bln
+4.973 mln
0.48%
jan 1, 2013
1.356 bln
+319.115 mln
30.78%
jan 1, 2014
1.118 bln
-238.014 mln
-17.55%
jan 1, 2015
910.671 mln
-207.32 mln
-18.54%
jan 1, 2016
1.352 bln
+441.507 mln
48.48%
Ranking of countries by current statistics by years


Comments: