29
/
en
AIzaSyAYiBZKx7MnpbEhh9jyipgxe19OcubqV5w
April 1, 2024
45907
Low income
LIC
false
2
1
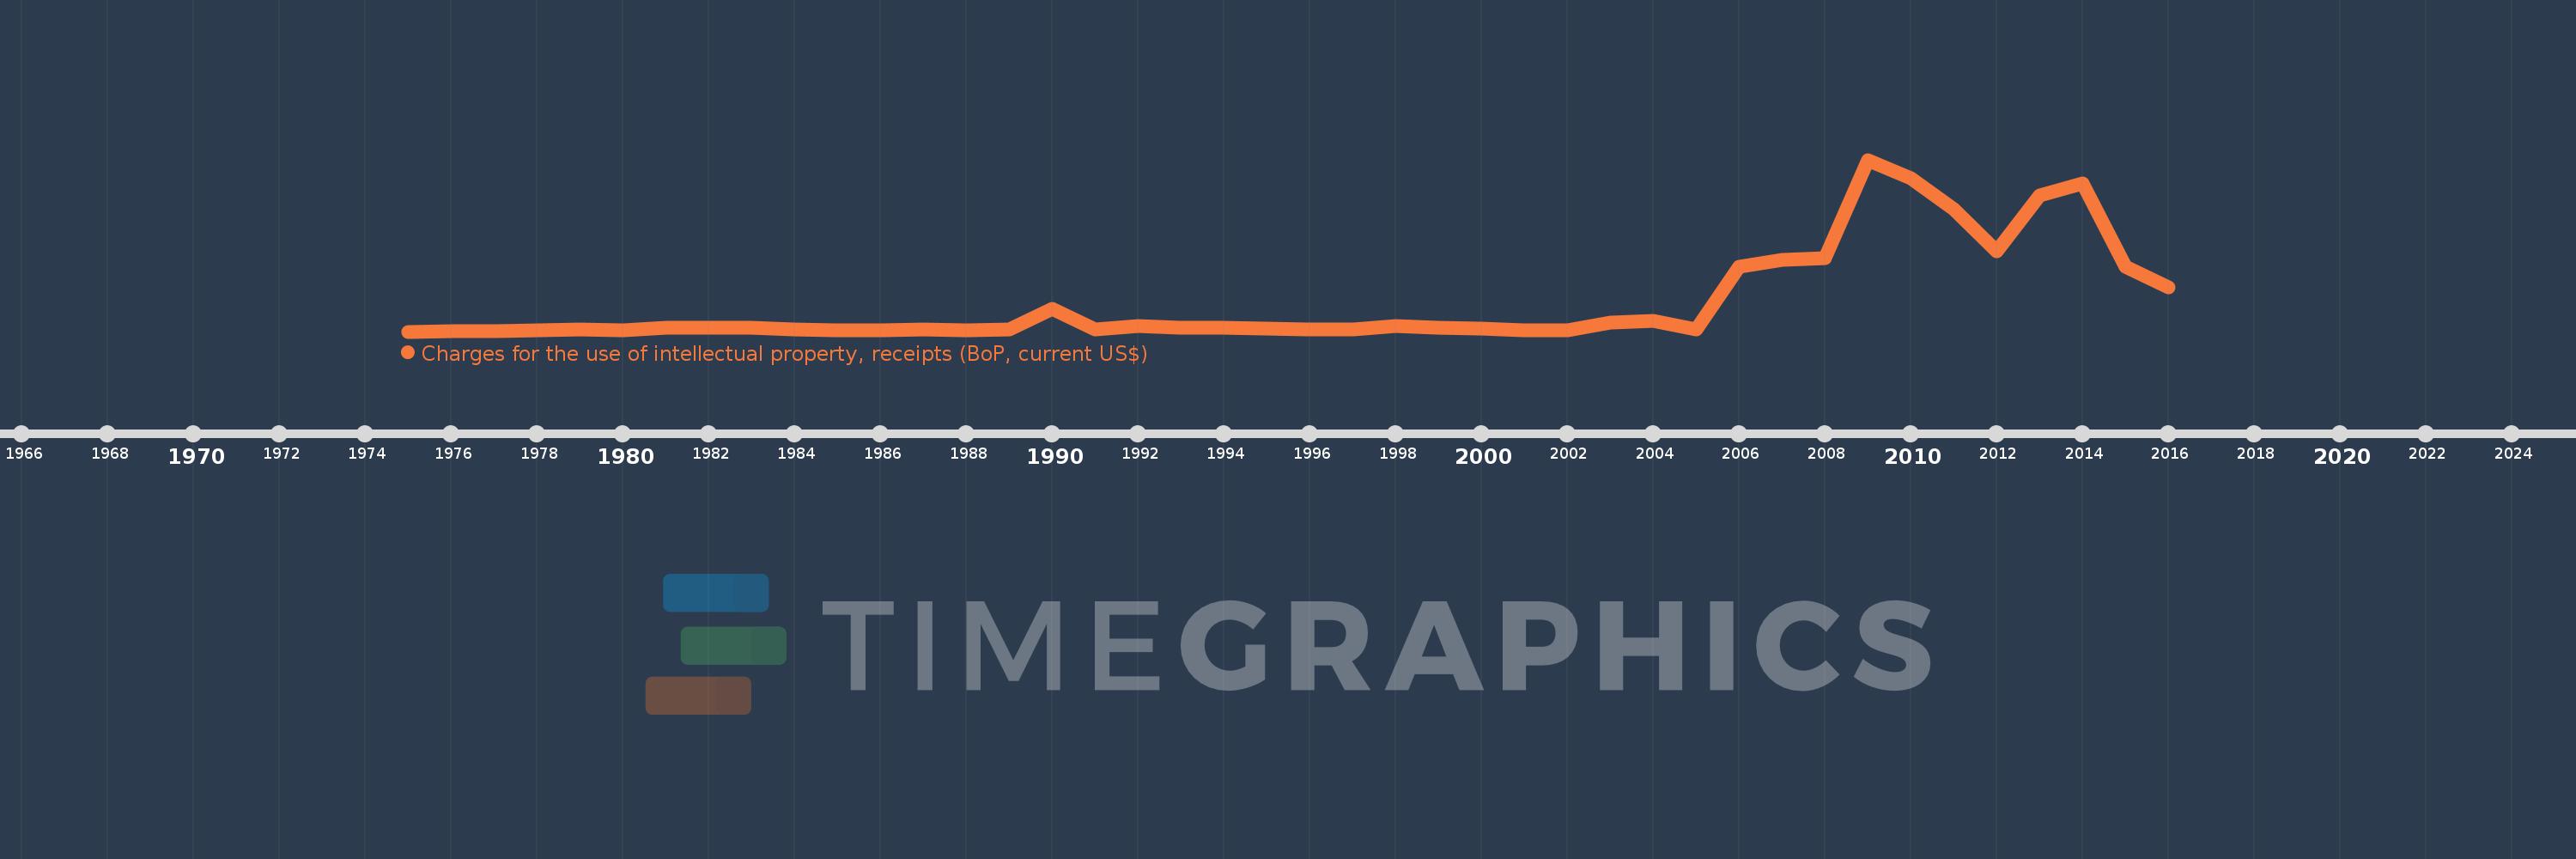
Charges for the use of intellectual property, receipts (BoP, current US$)
2016,2015,2014,2013,2012,2011,2010,2009,2008,2007,2006,2005,2004,2003,2002,2001,2000,1999,1998,1997,1996,1995,1994,1993,1992,1991,1990,1989,1988,1987,1986,1985,1984,1983,1982,1981,1980,1979,1978,1977,1976,1975
This statistics in other country:
Timeline:
This timeline shows a graph from 1975 to 2016 of Low income. No data until 1974. Number of actual observations by date: 42.
Source name:
World Development Indicators
Source organization:
International Monetary Fund, Balance of Payments Statistics Yearbook and data files.
Categories, topics:
Economy & Growth, Science & Technology
Last updated:
apr 23, 2017
Indicators value changes by year
Minimum:
41.545K
jan 1, 1975
Maximum:
140.559 mln
jan 1, 2009
At the date of observation
Value
Absolute change
Change from previous value
jan 1, 1975
41.545K
+41.545K
0.0%
jan 1, 1976
46.661K
+5.116K
12.31%
jan 1, 1977
41.85K
-4.811K
-10.31%
jan 1, 1978
835.535K
+793.686K
1.9K%
jan 1, 1979
1.823 mln
+987.021K
118.13%
jan 1, 1980
1.123 mln
-699.877K
-38.4%
jan 1, 1981
2.884 mln
+1.761 mln
156.89%
jan 1, 1982
3.309 mln
+425.179K
14.74%
jan 1, 1983
3.186 mln
-123.682K
-3.74%
jan 1, 1984
2.008 mln
-1.177 mln
-36.96%
jan 1, 1985
1.426 mln
-582.288K
-28.99%
jan 1, 1986
1.297 mln
-129.141K
-9.06%
jan 1, 1987
1.82 mln
+522.937K
40.32%
jan 1, 1988
1.418 mln
-401.597K
-22.07%
jan 1, 1989
1.493 mln
+75.099K
5.3%
jan 1, 1990
18.554 mln
+17.061 mln
1.14K%
jan 1, 1991
2.121 mln
-16.433 mln
-88.57%
jan 1, 1992
4.457 mln
+2.336 mln
110.14%
jan 1, 1993
3.039 mln
-1.418 mln
-31.82%
jan 1, 1994
3.209 mln
+170.098K
5.6%
jan 1, 1995
2.737 mln
-471.964K
-14.71%
jan 1, 1996
1.981 mln
-755.335K
-27.6%
jan 1, 1997
1.458 mln
-523.247K
-26.41%
jan 1, 1998
4.284 mln
+2.826 mln
193.8%
jan 1, 1999
3.193 mln
-1.092 mln
-25.48%
jan 1, 2000
2.632 mln
-560.867K
-17.57%
jan 1, 2001
1.166 mln
-1.466 mln
-55.69%
jan 1, 2002
1.344 mln
+177.721K
15.24%
jan 1, 2003
7.169 mln
+5.825 mln
433.49%
jan 1, 2004
8.623 mln
+1.454 mln
20.28%
jan 1, 2005
1.799 mln
-6.824 mln
-79.14%
jan 1, 2006
52.901 mln
+51.103 mln
2.84K%
jan 1, 2007
58.809 mln
+5.908 mln
11.17%
jan 1, 2008
60.096 mln
+1.287 mln
2.19%
jan 1, 2009
140.559 mln
+80.464 mln
133.89%
jan 1, 2010
125.542 mln
-15.018 mln
-10.68%
jan 1, 2011
99.87 mln
-25.671 mln
-20.45%
jan 1, 2012
65.666 mln
-34.204 mln
-34.25%
jan 1, 2013
111.431 mln
+45.765 mln
69.69%
jan 1, 2014
121.371 mln
+9.94 mln
8.92%
jan 1, 2015
53.164 mln
-68.207 mln
-56.2%
jan 1, 2016
36.303 mln
-16.86 mln
-31.71%
Ranking of countries by current statistics by years


Comments: