29
/
en
AIzaSyAYiBZKx7MnpbEhh9jyipgxe19OcubqV5w
April 1, 2024
31366
Europe & Central Asia (excluding high income)
ECA
false
2
1
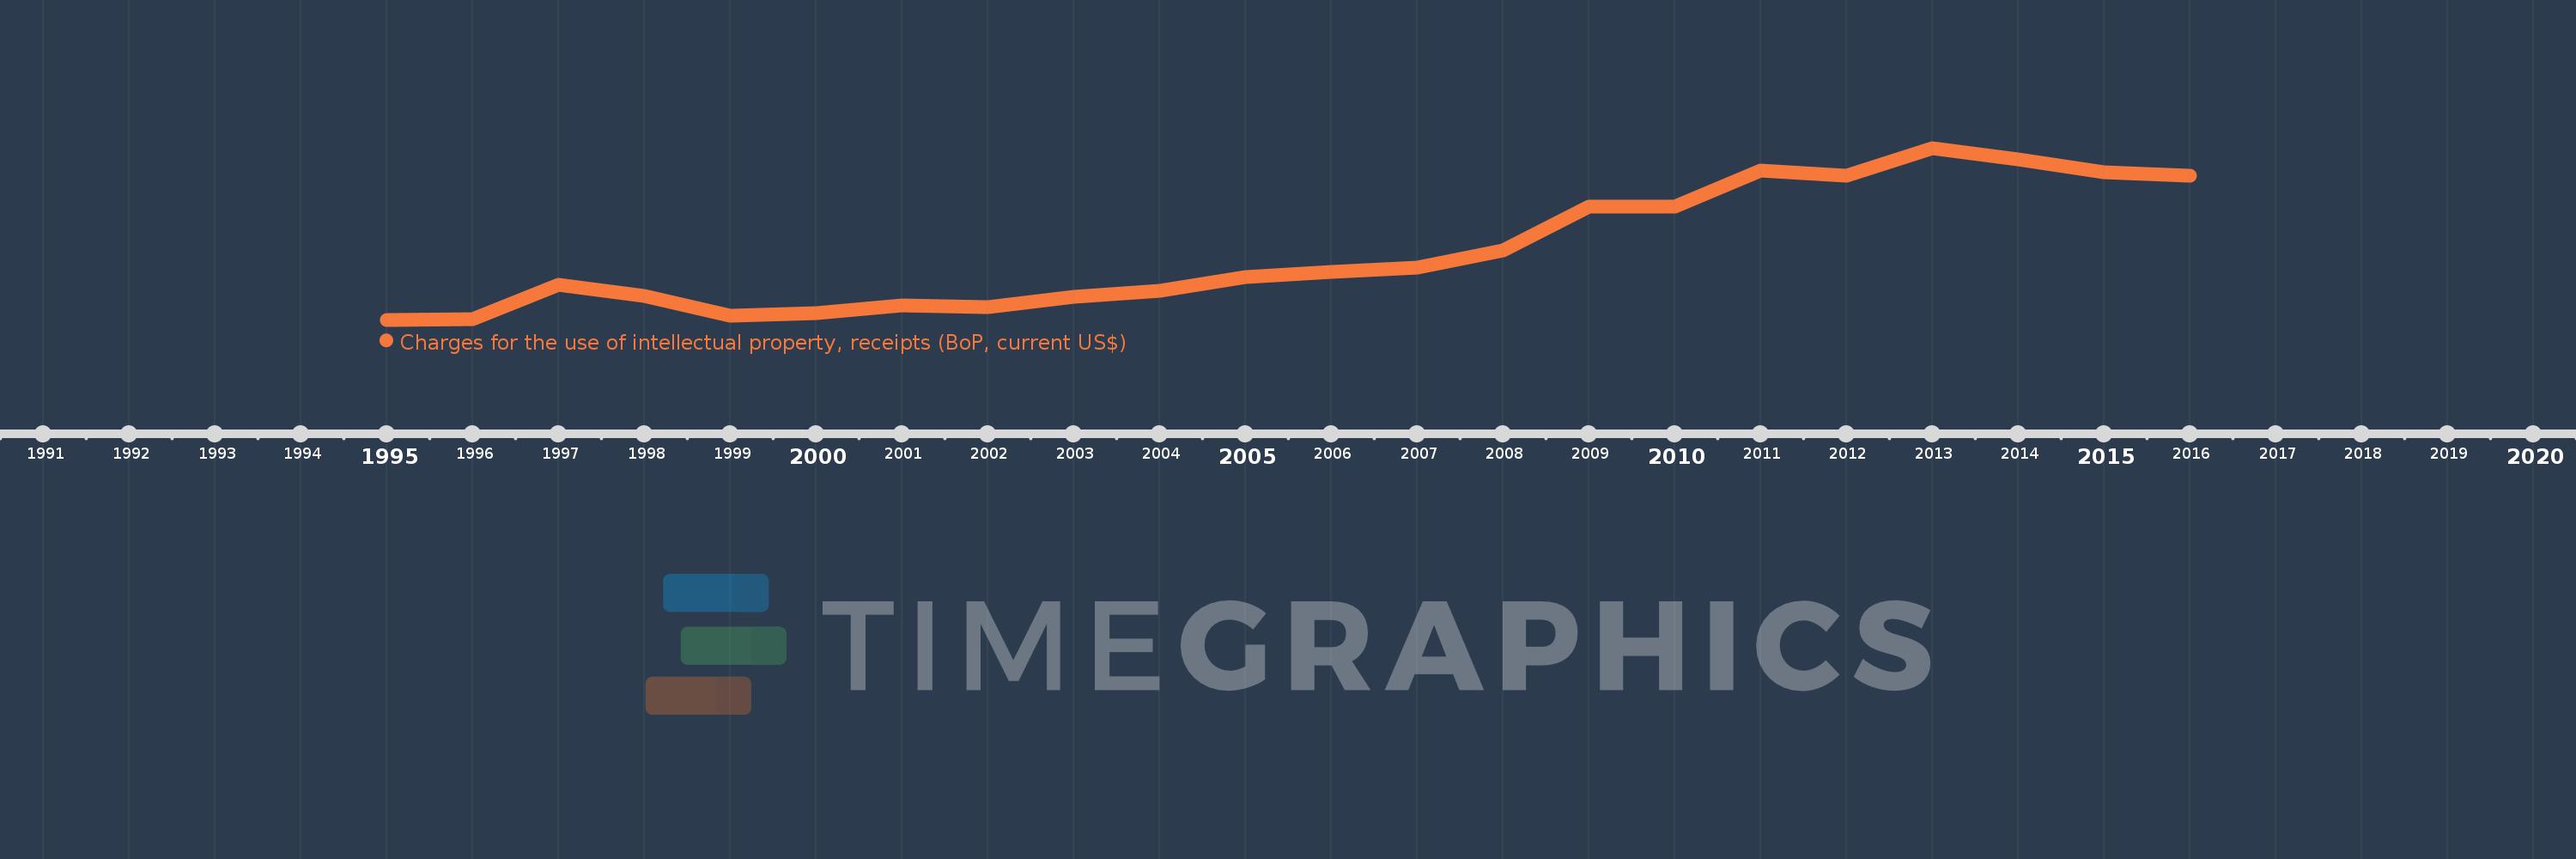
Charges for the use of intellectual property, receipts (BoP, current US$)
2016,2015,2014,2013,2012,2011,2010,2009,2008,2007,2006,2005,2004,2003,2002,2001,2000,1999,1998,1997,1996,1995
This statistics in other country:
Timeline:
This timeline shows a graph from 1995 to 2016 of Europe & Central Asia (excluding high income). No data until 1994. Number of actual observations by date: 22.
Source name:
World Development Indicators
Source organization:
International Monetary Fund, Balance of Payments Statistics Yearbook and data files.
Categories, topics:
Economy & Growth, Science & Technology
Last updated:
apr 23, 2017
Indicators value changes by year
Minimum:
5.61 mln
jan 1, 1995
Maximum:
1.251 bln
jan 1, 2013
At the date of observation
Value
Absolute change
Change from previous value
jan 1, 1995
5.61 mln
+5.61 mln
0.0%
jan 1, 1996
7.03 mln
+1.42 mln
25.31%
jan 1, 1997
261.53 mln
+254.5 mln
3.62K%
jan 1, 1998
179.32 mln
-82.21 mln
-31.43%
jan 1, 1999
35.114 mln
-144.206 mln
-80.42%
jan 1, 2000
52.45 mln
+17.336 mln
49.37%
jan 1, 2001
111.431 mln
+58.981 mln
112.45%
jan 1, 2002
94.207 mln
-17.224 mln
-15.46%
jan 1, 2003
169.509 mln
+75.301 mln
79.93%
jan 1, 2004
213.413 mln
+43.905 mln
25.9%
jan 1, 2005
313.571 mln
+100.158 mln
46.93%
jan 1, 2006
351.719 mln
+38.148 mln
12.17%
jan 1, 2007
382.671 mln
+30.951 mln
8.8%
jan 1, 2008
508.416 mln
+125.746 mln
32.86%
jan 1, 2009
823.652 mln
+315.235 mln
62.0%
jan 1, 2010
822.906 mln
-745.836K
-0.09%
jan 1, 2011
1.085 bln
+262.283 mln
31.87%
jan 1, 2012
1.053 bln
-32.356 mln
-2.98%
jan 1, 2013
1.251 bln
+198.375 mln
18.84%
jan 1, 2014
1.166 bln
-84.807 mln
-6.78%
jan 1, 2015
1.073 bln
-93.308 mln
-8.0%
jan 1, 2016
1.051 bln
-22.262 mln
-2.07%
Ranking of countries by current statistics by years


Comments: