29
/
en
AIzaSyAYiBZKx7MnpbEhh9jyipgxe19OcubqV5w
April 1, 2024
229490
Russian Federation
RUS
true
2
1
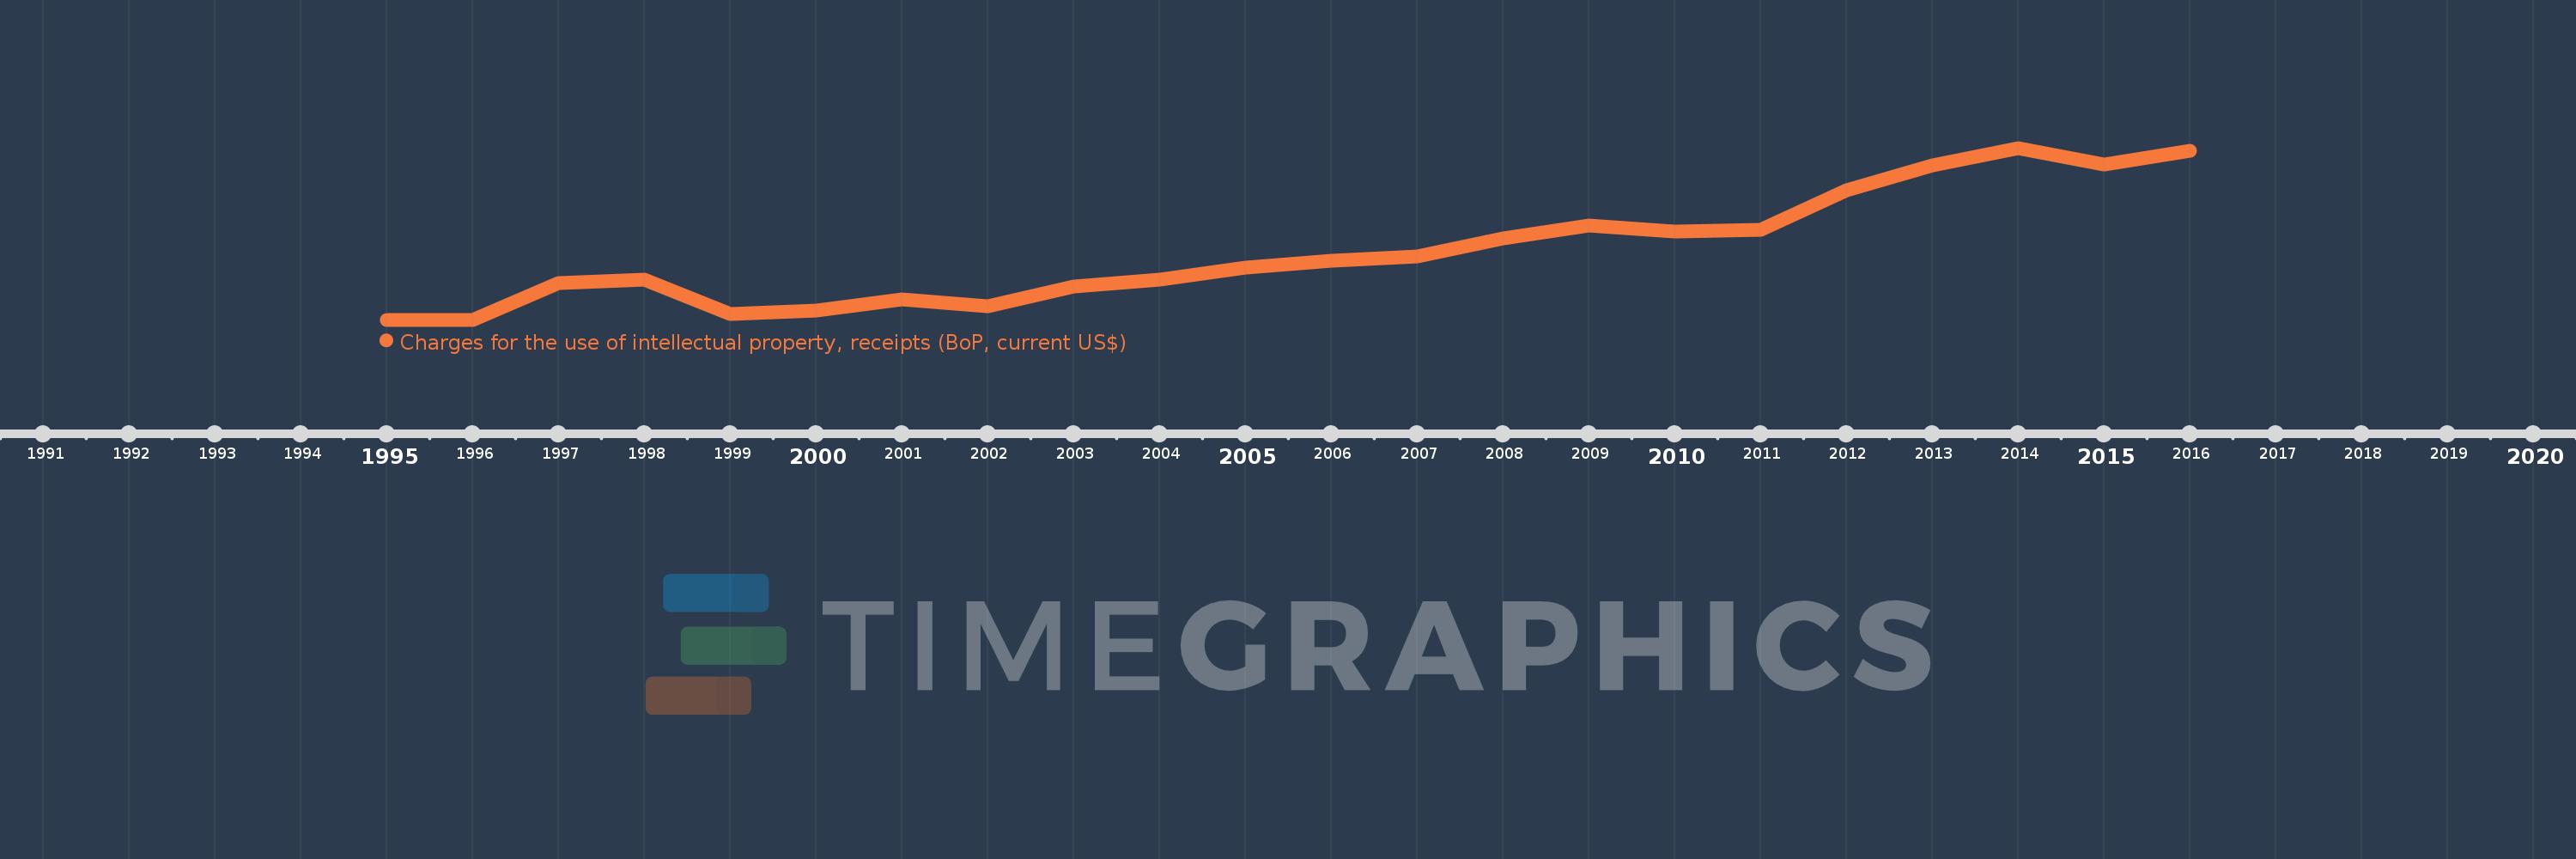
Charges for the use of intellectual property, receipts (BoP, current US$)
2016,2015,2014,2013,2012,2011,2010,2009,2008,2007,2006,2005,2004,2003,2002,2001,2000,1999,1998,1997,1996,1995
This statistics in other country:
Timeline:
This timeline shows a graph from 1995 to 2016 of Russian Federation. No data until 1994. Number of actual observations by date: 22.
Source name:
World Development Indicators
Source organization:
International Monetary Fund, Balance of Payments Statistics Yearbook and data files.
Categories, topics:
Economy & Growth, Science & Technology
Last updated:
apr 23, 2017
Indicators value changes by year
Minimum:
3.61 mln
jan 1, 1995
Maximum:
737.89 mln
jan 1, 2014
At the date of observation
Value
Absolute change
Change from previous value
jan 1, 1995
3.61 mln
+3.61 mln
0.0%
jan 1, 1996
4.03 mln
+420.0K
11.63%
jan 1, 1997
159.21 mln
+155.18 mln
3.85K%
jan 1, 1998
176.07 mln
+16.86 mln
10.59%
jan 1, 1999
27.03 mln
-149.04 mln
-84.65%
jan 1, 2000
42.54 mln
+15.51 mln
57.38%
jan 1, 2001
91.34 mln
+48.8 mln
114.72%
jan 1, 2002
60.37 mln
-30.97 mln
-33.91%
jan 1, 2003
146.79 mln
+86.42 mln
143.15%
jan 1, 2004
173.61 mln
+26.82 mln
18.27%
jan 1, 2005
226.06 mln
+52.45 mln
30.21%
jan 1, 2006
256.34 mln
+30.28 mln
13.39%
jan 1, 2007
273.29 mln
+16.95 mln
6.61%
jan 1, 2008
351.53 mln
+78.24 mln
28.63%
jan 1, 2009
406.37 mln
+54.84 mln
15.6%
jan 1, 2010
380.76 mln
-25.61 mln
-6.3%
jan 1, 2011
386.22 mln
+5.46 mln
1.43%
jan 1, 2012
555.78 mln
+169.56 mln
43.9%
jan 1, 2013
664.2 mln
+108.42 mln
19.51%
jan 1, 2014
737.89 mln
+73.69 mln
11.09%
jan 1, 2015
665.79 mln
-72.1 mln
-9.77%
jan 1, 2016
726.17 mln
+60.38 mln
9.07%
Ranking of countries by current statistics by years


Comments: