29
/
en
AIzaSyAYiBZKx7MnpbEhh9jyipgxe19OcubqV5w
April 1, 2024
41266
Latin America & Caribbean
LCN
false
2
1
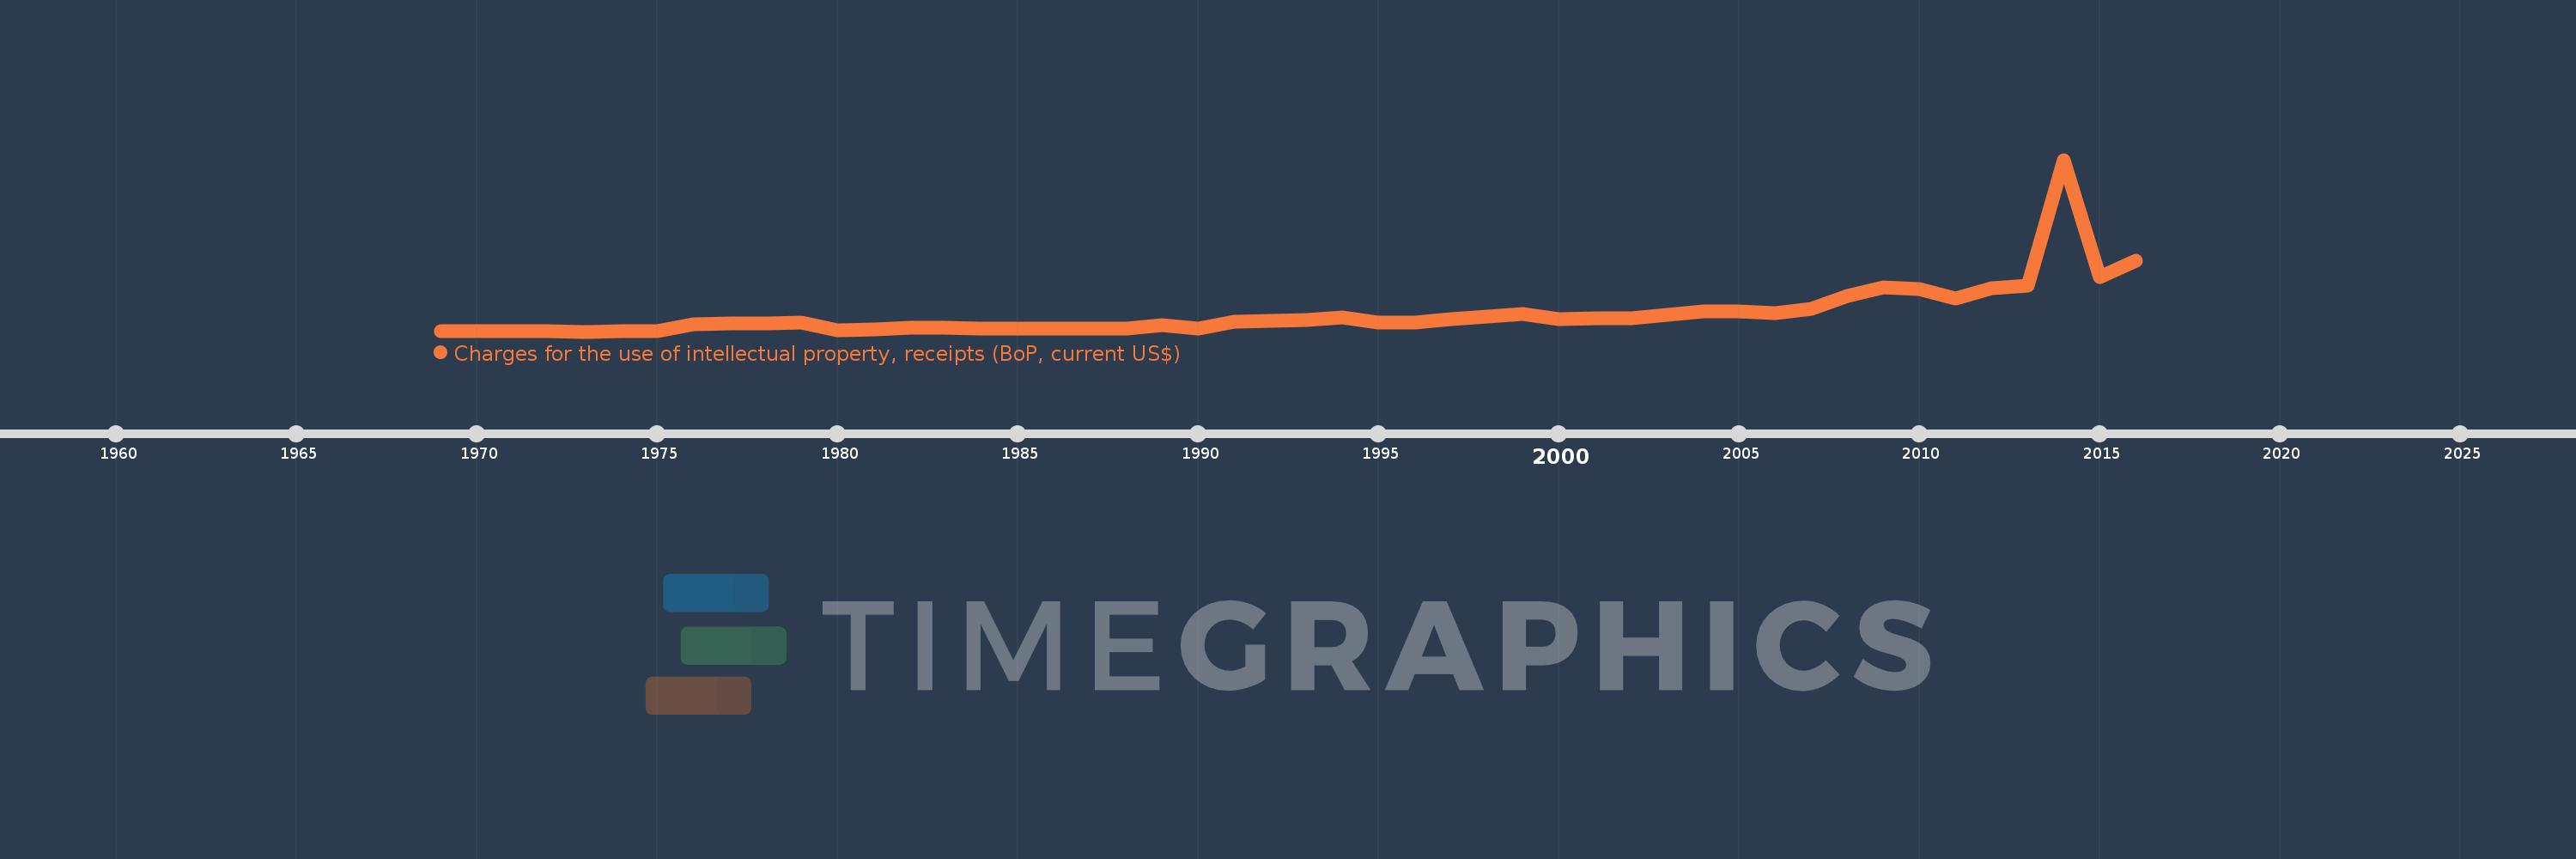
Charges for the use of intellectual property, receipts (BoP, current US$)
2016,2015,2014,2013,2012,2011,2010,2009,2008,2007,2006,2005,2004,2003,2002,2001,2000,1999,1998,1997,1996,1995,1994,1993,1992,1991,1990,1989,1988,1987,1986,1985,1984,1983,1982,1981,1980,1979,1978,1977,1976,1975,1974,1973,1972,1971,1970,1969
This statistics in other country:
Timeline:
This timeline shows a graph from 1969 to 2016 of Latin America & Caribbean . No data until 1968. Number of actual observations by date: 48.
Source name:
World Development Indicators
Source organization:
International Monetary Fund, Balance of Payments Statistics Yearbook and data files.
Categories, topics:
Economy & Growth, Science & Technology
Last updated:
apr 23, 2017
Indicators value changes by year
Minimum:
2.171 mln
jan 1, 1973
Maximum:
3.269 bln
jan 1, 2014
At the date of observation
Value
Absolute change
Change from previous value
jan 1, 1969
8.0 mln
+8.0 mln
0.0%
jan 1, 1970
8.0 mln
0.0
0.0%
jan 1, 1971
3.0 mln
-5.0 mln
-62.5%
jan 1, 1972
3.009 mln
+8.94K
0.3%
jan 1, 1973
2.171 mln
-837.52K
-27.83%
jan 1, 1974
2.384 mln
+212.84K
9.8%
jan 1, 1975
2.405 mln
+21.02K
0.88%
jan 1, 1976
143.0 mln
+140.595 mln
5.85K%
jan 1, 1977
163.0 mln
+20.0 mln
13.99%
jan 1, 1978
154.5 mln
-8.5 mln
-5.21%
jan 1, 1979
173.2 mln
+18.7 mln
12.1%
jan 1, 1980
30.6 mln
-142.6 mln
-82.33%
jan 1, 1981
50.15 mln
+19.55 mln
63.89%
jan 1, 1982
74.9 mln
+24.75 mln
49.35%
jan 1, 1983
76.55 mln
+1.65 mln
2.2%
jan 1, 1984
57.75 mln
-18.8 mln
-24.56%
jan 1, 1985
61.7 mln
+3.95 mln
6.84%
jan 1, 1986
58.55 mln
-3.15 mln
-5.11%
jan 1, 1987
58.0 mln
-550.0K
-0.94%
jan 1, 1988
55.0 mln
-3.0 mln
-5.17%
jan 1, 1989
122.75 mln
+67.75 mln
123.18%
jan 1, 1990
62.95 mln
-59.8 mln
-48.72%
jan 1, 1991
195.25 mln
+132.3 mln
210.17%
jan 1, 1992
210.65 mln
+15.4 mln
7.89%
jan 1, 1993
214.6 mln
+3.95 mln
1.88%
jan 1, 1994
277.69 mln
+63.09 mln
29.4%
jan 1, 1995
176.236 mln
-101.454 mln
-36.54%
jan 1, 1996
168.617 mln
-7.619 mln
-4.32%
jan 1, 1997
247.017 mln
+78.401 mln
46.5%
jan 1, 1998
287.322 mln
+40.305 mln
16.32%
jan 1, 1999
341.074 mln
+53.752 mln
18.71%
jan 1, 2000
239.543 mln
-101.531 mln
-29.77%
jan 1, 2001
247.34 mln
+7.797 mln
3.25%
jan 1, 2002
260.72 mln
+13.38 mln
5.41%
jan 1, 2003
318.137 mln
+57.417 mln
22.02%
jan 1, 2004
388.888 mln
+70.751 mln
22.24%
jan 1, 2005
378.216 mln
-10.672 mln
-2.74%
jan 1, 2006
351.159 mln
-27.058 mln
-7.15%
jan 1, 2007
442.412 mln
+91.254 mln
25.99%
jan 1, 2008
671.914 mln
+229.502 mln
51.88%
jan 1, 2009
844.494 mln
+172.58 mln
25.68%
jan 1, 2010
806.306 mln
-38.188 mln
-4.52%
jan 1, 2011
631.885 mln
-174.422 mln
-21.63%
jan 1, 2012
821.028 mln
+189.143 mln
29.93%
jan 1, 2013
877.991 mln
+56.963 mln
6.94%
jan 1, 2014
3.269 bln
+2.391 bln
272.3%
jan 1, 2015
1.041 bln
-2.227 bln
-68.14%
jan 1, 2016
1.345 bln
+303.379 mln
29.13%
Ranking of countries by current statistics by years


Comments: