29
/
en
AIzaSyAYiBZKx7MnpbEhh9jyipgxe19OcubqV5w
April 1, 2024
139054
Germany
DEU
true
2
1
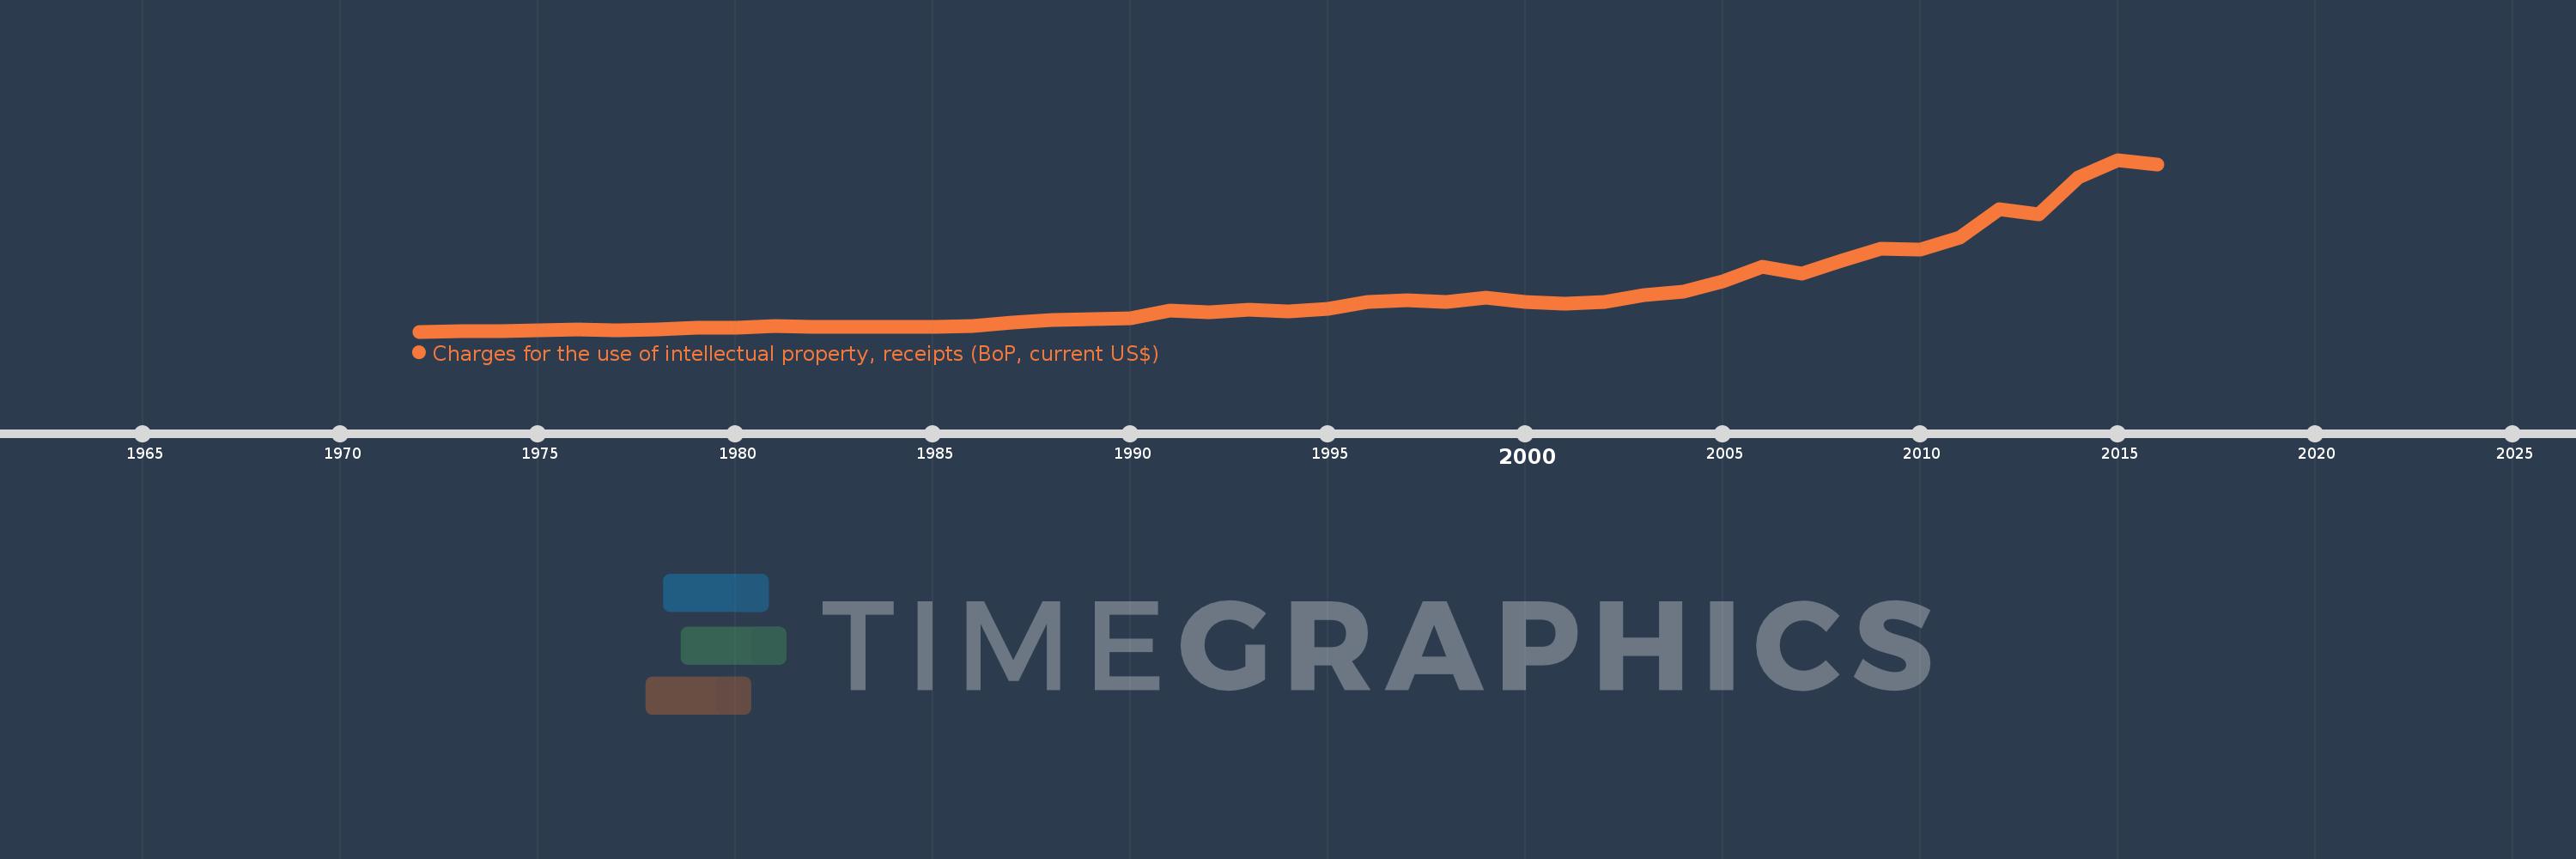
Charges for the use of intellectual property, receipts (BoP, current US$)
2016,2015,2014,2013,2012,2011,2010,2009,2008,2007,2006,2005,2004,2003,2002,2001,2000,1999,1998,1997,1996,1995,1994,1993,1992,1991,1990,1989,1988,1987,1986,1985,1984,1983,1982,1981,1980,1979,1978,1977,1976,1975,1974,1973,1972
This statistics in other country:
Timeline:
This timeline shows a graph from 1972 to 2016 of Germany. No data until 1971. Number of actual observations by date: 45.
Source name:
World Development Indicators
Source organization:
International Monetary Fund, Balance of Payments Statistics Yearbook and data files.
Categories, topics:
Economy & Growth, Science & Technology
Last updated:
apr 23, 2017
Indicators value changes by year
Minimum:
156.38 mln
jan 1, 1972
Maximum:
14.993 bln
jan 1, 2015
At the date of observation
Value
Absolute change
Change from previous value
jan 1, 1972
156.38 mln
+156.38 mln
0.0%
jan 1, 1973
211.277 mln
+54.897 mln
35.1%
jan 1, 1974
225.35 mln
+14.073 mln
6.66%
jan 1, 1975
275.54 mln
+50.189 mln
22.27%
jan 1, 1976
324.886 mln
+49.346 mln
17.91%
jan 1, 1977
304.439 mln
-20.447 mln
-6.29%
jan 1, 1978
355.86 mln
+51.422 mln
16.89%
jan 1, 1979
462.287 mln
+106.426 mln
29.91%
jan 1, 1980
525.966 mln
+63.679 mln
13.77%
jan 1, 1981
606.121 mln
+80.156 mln
15.24%
jan 1, 1982
546.036 mln
-60.086 mln
-9.91%
jan 1, 1983
561.912 mln
+15.876 mln
2.91%
jan 1, 1984
592.845 mln
+30.933 mln
5.5%
jan 1, 1985
583.238 mln
-9.607 mln
-1.62%
jan 1, 1986
618.173 mln
+34.935 mln
5.99%
jan 1, 1987
920.418 mln
+302.245 mln
48.89%
jan 1, 1988
1.161 bln
+240.909 mln
26.17%
jan 1, 1989
1.265 bln
+103.694 mln
8.93%
jan 1, 1990
1.341 bln
+75.489 mln
5.97%
jan 1, 1991
1.987 bln
+646.472 mln
48.23%
jan 1, 1992
1.837 bln
-149.651 mln
-7.53%
jan 1, 1993
2.026 bln
+188.857 mln
10.28%
jan 1, 1994
1.933 bln
-93.151 mln
-4.6%
jan 1, 1995
2.111 bln
+178.131 mln
9.22%
jan 1, 1996
2.706 bln
+594.368 mln
28.15%
jan 1, 1997
2.879 bln
+173.272 mln
6.4%
jan 1, 1998
2.737 bln
-141.879 mln
-4.93%
jan 1, 1999
3.095 bln
+357.932 mln
13.08%
jan 1, 2000
2.691 bln
-404.16 mln
-13.06%
jan 1, 2001
2.536 bln
-154.863 mln
-5.76%
jan 1, 2002
2.741 bln
+205.118 mln
8.09%
jan 1, 2003
3.32 bln
+578.698 mln
21.11%
jan 1, 2004
3.576 bln
+256.297 mln
7.72%
jan 1, 2005
4.463 bln
+887.067 mln
24.81%
jan 1, 2006
5.75 bln
+1.287 bln
28.84%
jan 1, 2007
5.161 bln
-589.555 mln
-10.25%
jan 1, 2008
6.31 bln
+1.15 bln
22.28%
jan 1, 2009
7.336 bln
+1.026 bln
16.25%
jan 1, 2010
7.208 bln
-127.835 mln
-1.74%
jan 1, 2011
8.279 bln
+1.071 bln
14.86%
jan 1, 2012
10.716 bln
+2.437 bln
29.43%
jan 1, 2013
10.299 bln
-417.16 mln
-3.89%
jan 1, 2014
13.44 bln
+3.142 bln
30.5%
jan 1, 2015
14.993 bln
+1.552 bln
11.55%
jan 1, 2016
14.585 bln
-407.54 mln
-2.72%
Ranking of countries by current statistics by years


Comments: