29
/
en
AIzaSyAYiBZKx7MnpbEhh9jyipgxe19OcubqV5w
April 1, 2024
195250
Mexico
MEX
true
2
1
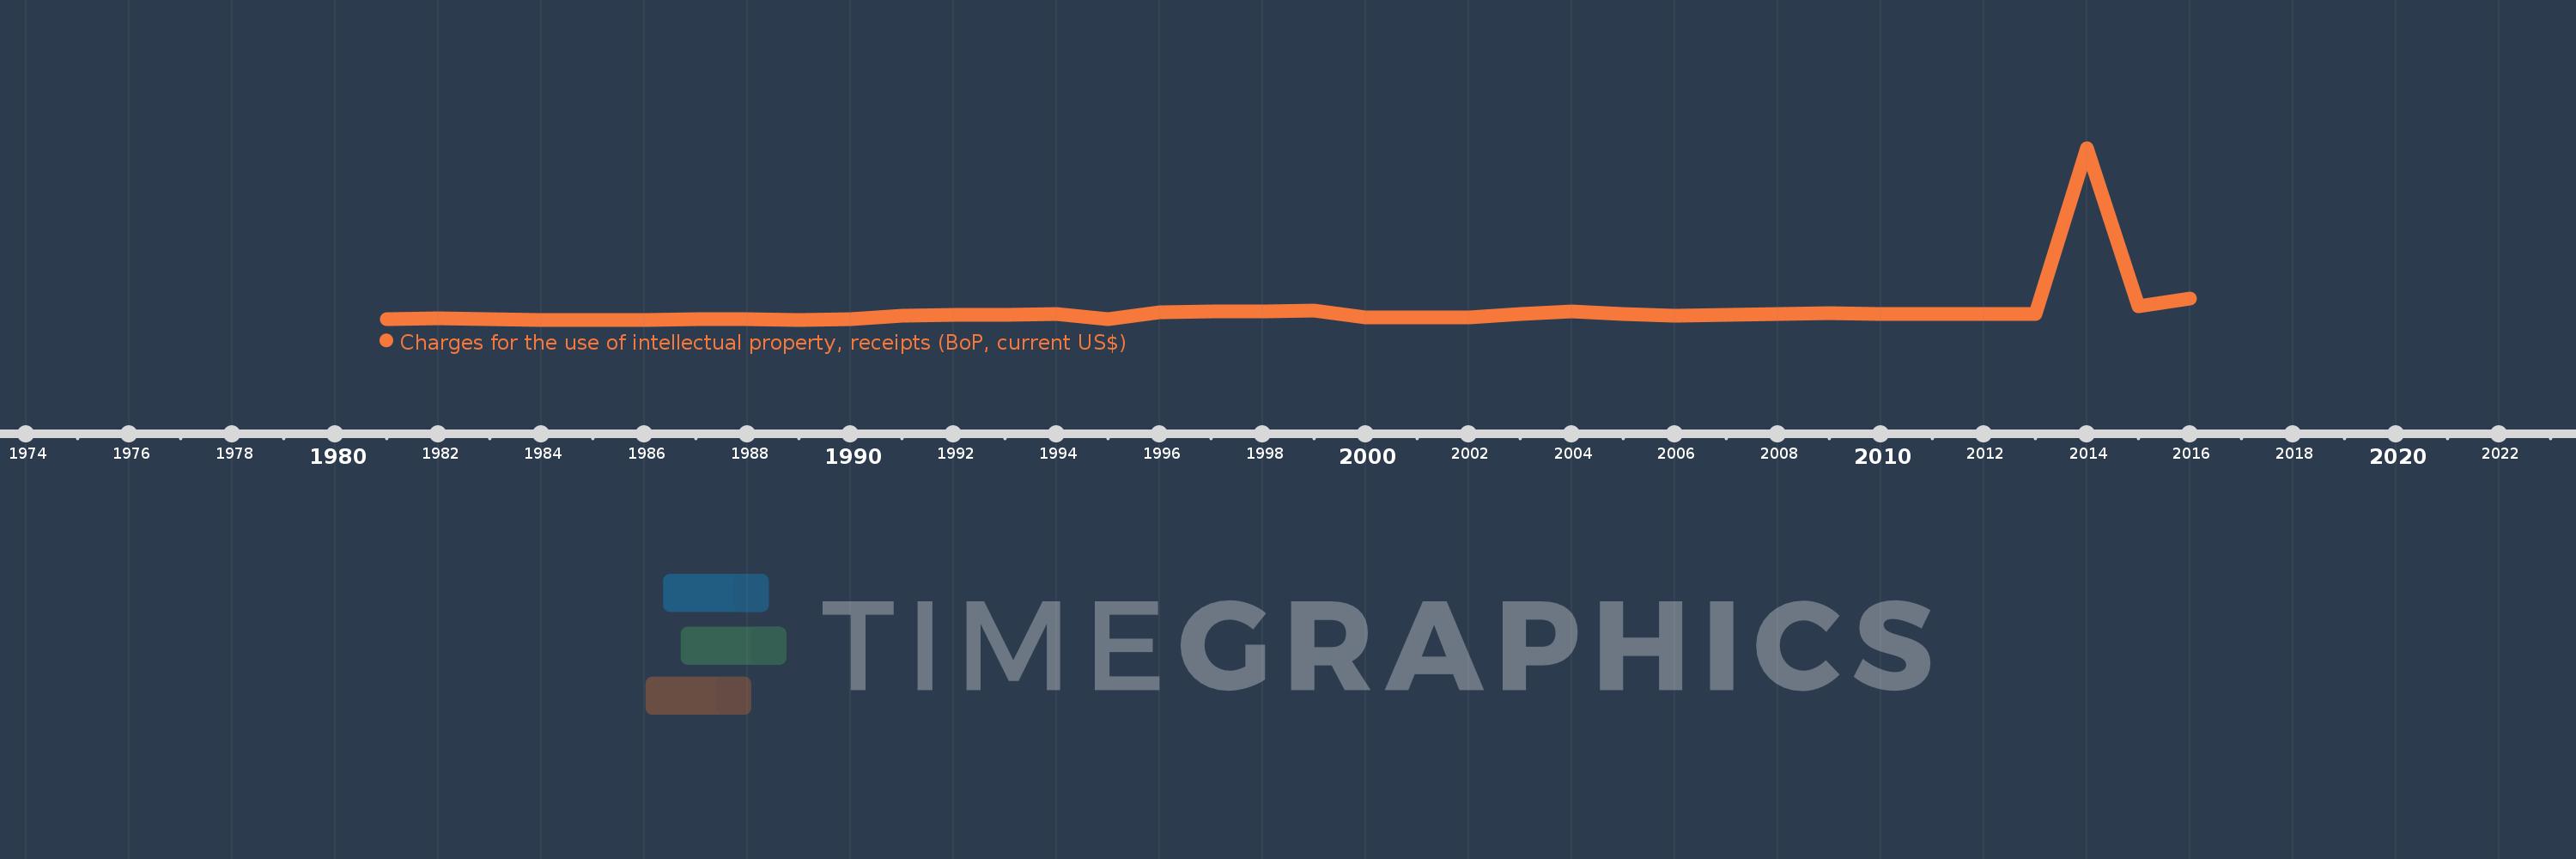
Charges for the use of intellectual property, receipts (BoP, current US$)
2016,2015,2014,2013,2012,2011,2010,2009,2008,2007,2006,2005,2004,2003,2002,2001,2000,1999,1998,1997,1996,1995,1994,1993,1992,1991,1990,1989,1988,1987,1986,1985,1984,1983,1982,1981
This statistics in other country:
Timeline:
This timeline shows a graph from 1981 to 2016 of Mexico. No data until 1980. Number of actual observations by date: 36.
Source name:
World Development Indicators
Source organization:
International Monetary Fund, Balance of Payments Statistics Yearbook and data files.
Categories, topics:
Economy & Growth, Science & Technology
Last updated:
apr 23, 2017
Indicators value changes by year
Minimum:
12.0 mln
jan 1, 1986
Maximum:
2.373 bln
jan 1, 2014
At the date of observation
Value
Absolute change
Change from previous value
jan 1, 1981
21.0 mln
+21.0 mln
0.0%
jan 1, 1982
32.0 mln
+11.0 mln
52.38%
jan 1, 1983
23.0 mln
-9.0 mln
-28.13%
jan 1, 1984
14.0 mln
-9.0 mln
-39.13%
jan 1, 1985
13.0 mln
-1000.0K
-7.14%
jan 1, 1986
12.0 mln
-1000.0K
-7.69%
jan 1, 1987
18.0 mln
+6.0 mln
50.0%
jan 1, 1988
21.0 mln
+3.0 mln
16.67%
jan 1, 1989
14.0 mln
-7.0 mln
-33.33%
jan 1, 1990
21.0 mln
+7.0 mln
50.0%
jan 1, 1991
73.0 mln
+52.0 mln
247.62%
jan 1, 1992
78.0 mln
+5.0 mln
6.85%
jan 1, 1993
85.0 mln
+7.0 mln
8.97%
jan 1, 1994
96.0 mln
+11.0 mln
12.94%
jan 1, 1995
19.85 mln
-76.15 mln
-79.32%
jan 1, 1996
114.44 mln
+94.59 mln
476.52%
jan 1, 1997
121.8 mln
+7.36 mln
6.43%
jan 1, 1998
129.9 mln
+8.1 mln
6.65%
jan 1, 1999
138.39 mln
+8.49 mln
6.54%
jan 1, 2000
42.046 mln
-96.344 mln
-69.62%
jan 1, 2001
43.077 mln
+1.031 mln
2.45%
jan 1, 2002
40.758 mln
-2.319 mln
-5.38%
jan 1, 2003
86.138 mln
+45.38 mln
111.34%
jan 1, 2004
123.555 mln
+37.417 mln
43.44%
jan 1, 2005
96.365 mln
-27.19 mln
-22.01%
jan 1, 2006
69.508 mln
-26.857 mln
-27.87%
jan 1, 2007
81.2 mln
+11.692 mln
16.82%
jan 1, 2008
94.611 mln
+13.411 mln
16.52%
jan 1, 2009
97.269 mln
+2.658 mln
2.81%
jan 1, 2010
94.395 mln
-2.874 mln
-2.95%
jan 1, 2011
88.007 mln
-6.388 mln
-6.77%
jan 1, 2012
96.536 mln
+8.529 mln
9.69%
jan 1, 2013
95.626 mln
-909.614K
-0.94%
jan 1, 2014
2.373 bln
+2.278 bln
2.38K%
jan 1, 2015
193.572 mln
-2.18 bln
-91.84%
jan 1, 2016
307.772 mln
+114.2 mln
59.0%
Ranking of countries by current statistics by years


Comments: