29
/
en
AIzaSyAYiBZKx7MnpbEhh9jyipgxe19OcubqV5w
April 1, 2024
279554
Vanuatu
VUT
true
2
1
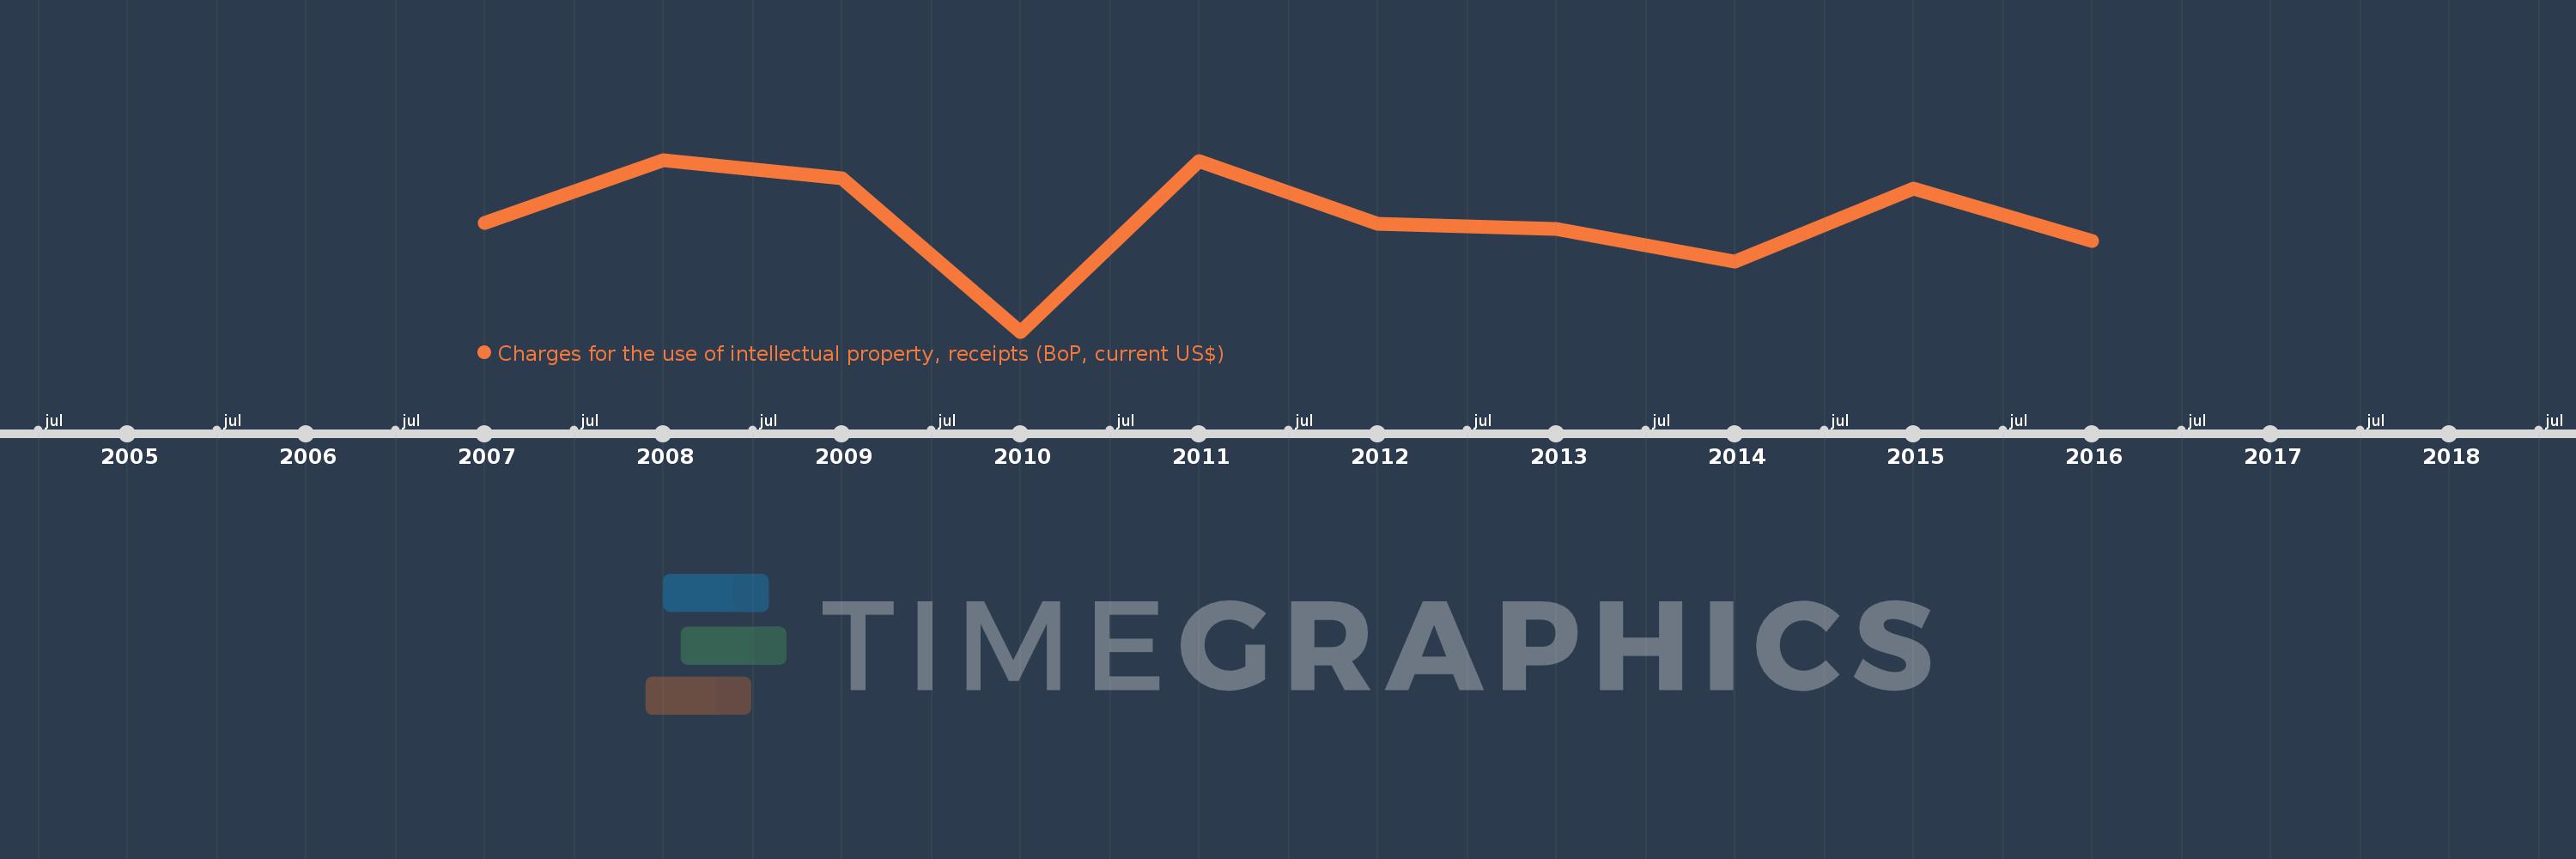
Charges for the use of intellectual property, receipts (BoP, current US$)
2016,2015,2014,2013,2012,2011,2010,2009,2008,2007
This statistics in other country:
Timeline:
This timeline shows a graph from 2007 to 2016 of Vanuatu. No data until 2006. Number of actual observations by date: 10.
Source name:
World Development Indicators
Source organization:
International Monetary Fund, Balance of Payments Statistics Yearbook and data files.
Categories, topics:
Economy & Growth, Science & Technology
Last updated:
apr 23, 2017
Indicators value changes by year
Minimum:
34.22K
jan 1, 2010
Maximum:
265.347K
jan 1, 2008
At the date of observation
Value
Absolute change
Change from previous value
jan 1, 2007
180.789K
+180.789K
0.0%
jan 1, 2008
265.347K
+84.559K
46.77%
jan 1, 2009
240.132K
-25.216K
-9.5%
jan 1, 2010
34.22K
-205.911K
-85.75%
jan 1, 2011
263.819K
+229.599K
670.95%
jan 1, 2012
179.06K
-84.759K
-32.13%
jan 1, 2013
172.724K
-6.336K
-3.54%
jan 1, 2014
128.451K
-44.272K
-25.63%
jan 1, 2015
227.034K
+98.583K
76.75%
jan 1, 2016
155.805K
-71.229K
-31.37%
Ranking of countries by current statistics by years


Comments: