29
/
en
AIzaSyAYiBZKx7MnpbEhh9jyipgxe19OcubqV5w
April 1, 2024
105742
China
CHN
true
2
1
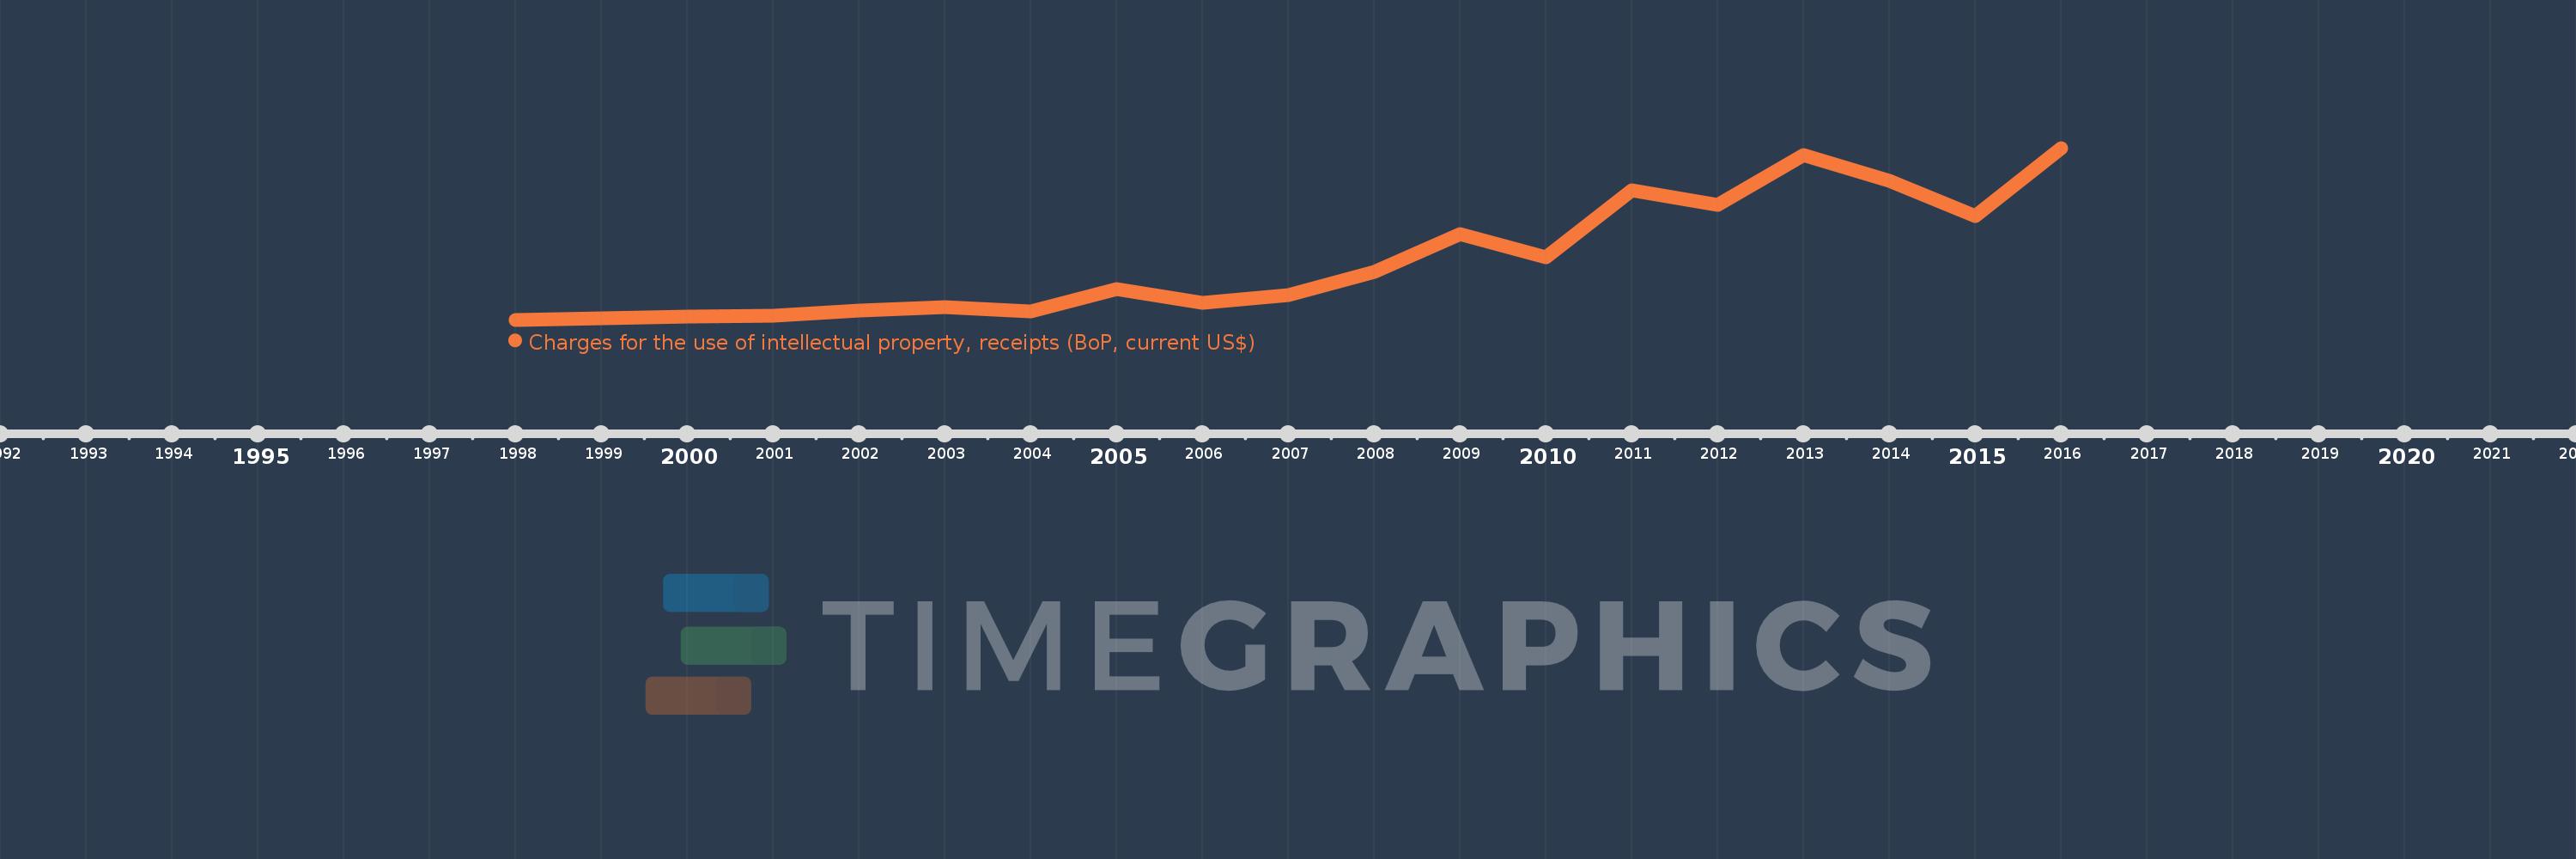
Charges for the use of intellectual property, receipts (BoP, current US$)
2016,2015,2014,2013,2012,2011,2010,2009,2008,2007,2006,2005,2004,2003,2002,2001,2000,1999,1998
This statistics in other country:
Timeline:
This timeline shows a graph from 1998 to 2016 of China. No data until 1997. Number of actual observations by date: 19.
Source name:
World Development Indicators
Source organization:
International Monetary Fund, Balance of Payments Statistics Yearbook and data files.
Categories, topics:
Economy & Growth, Science & Technology
Last updated:
apr 23, 2017
Indicators value changes by year
Minimum:
55.0 mln
jan 1, 1998
Maximum:
1.085 bln
jan 1, 2016
At the date of observation
Value
Absolute change
Change from previous value
jan 1, 1998
55.0 mln
+55.0 mln
0.0%
jan 1, 1999
63.0 mln
+8.0 mln
14.55%
jan 1, 2000
75.0 mln
+12.0 mln
19.05%
jan 1, 2001
80.348 mln
+5.348 mln
7.13%
jan 1, 2002
110.0 mln
+29.652 mln
36.9%
jan 1, 2003
132.822 mln
+22.822 mln
20.75%
jan 1, 2004
106.979 mln
-25.843 mln
-19.46%
jan 1, 2005
236.359 mln
+129.38 mln
120.94%
jan 1, 2006
157.402 mln
-78.957 mln
-33.41%
jan 1, 2007
204.504 mln
+47.102 mln
29.92%
jan 1, 2008
342.634 mln
+138.13 mln
67.54%
jan 1, 2009
570.536 mln
+227.902 mln
66.51%
jan 1, 2010
429.453 mln
-141.084 mln
-24.73%
jan 1, 2011
830.484 mln
+401.031 mln
93.38%
jan 1, 2012
743.302 mln
-87.182 mln
-10.5%
jan 1, 2013
1.044 bln
+300.8 mln
40.47%
jan 1, 2014
886.67 mln
-157.432 mln
-15.08%
jan 1, 2015
676.382 mln
-210.288 mln
-23.72%
jan 1, 2016
1.085 bln
+408.218 mln
60.35%
Ranking of countries by current statistics by years


Comments: