29
/
en
AIzaSyAYiBZKx7MnpbEhh9jyipgxe19OcubqV5w
April 1, 2024
153341
Iceland
ISL
true
2
1
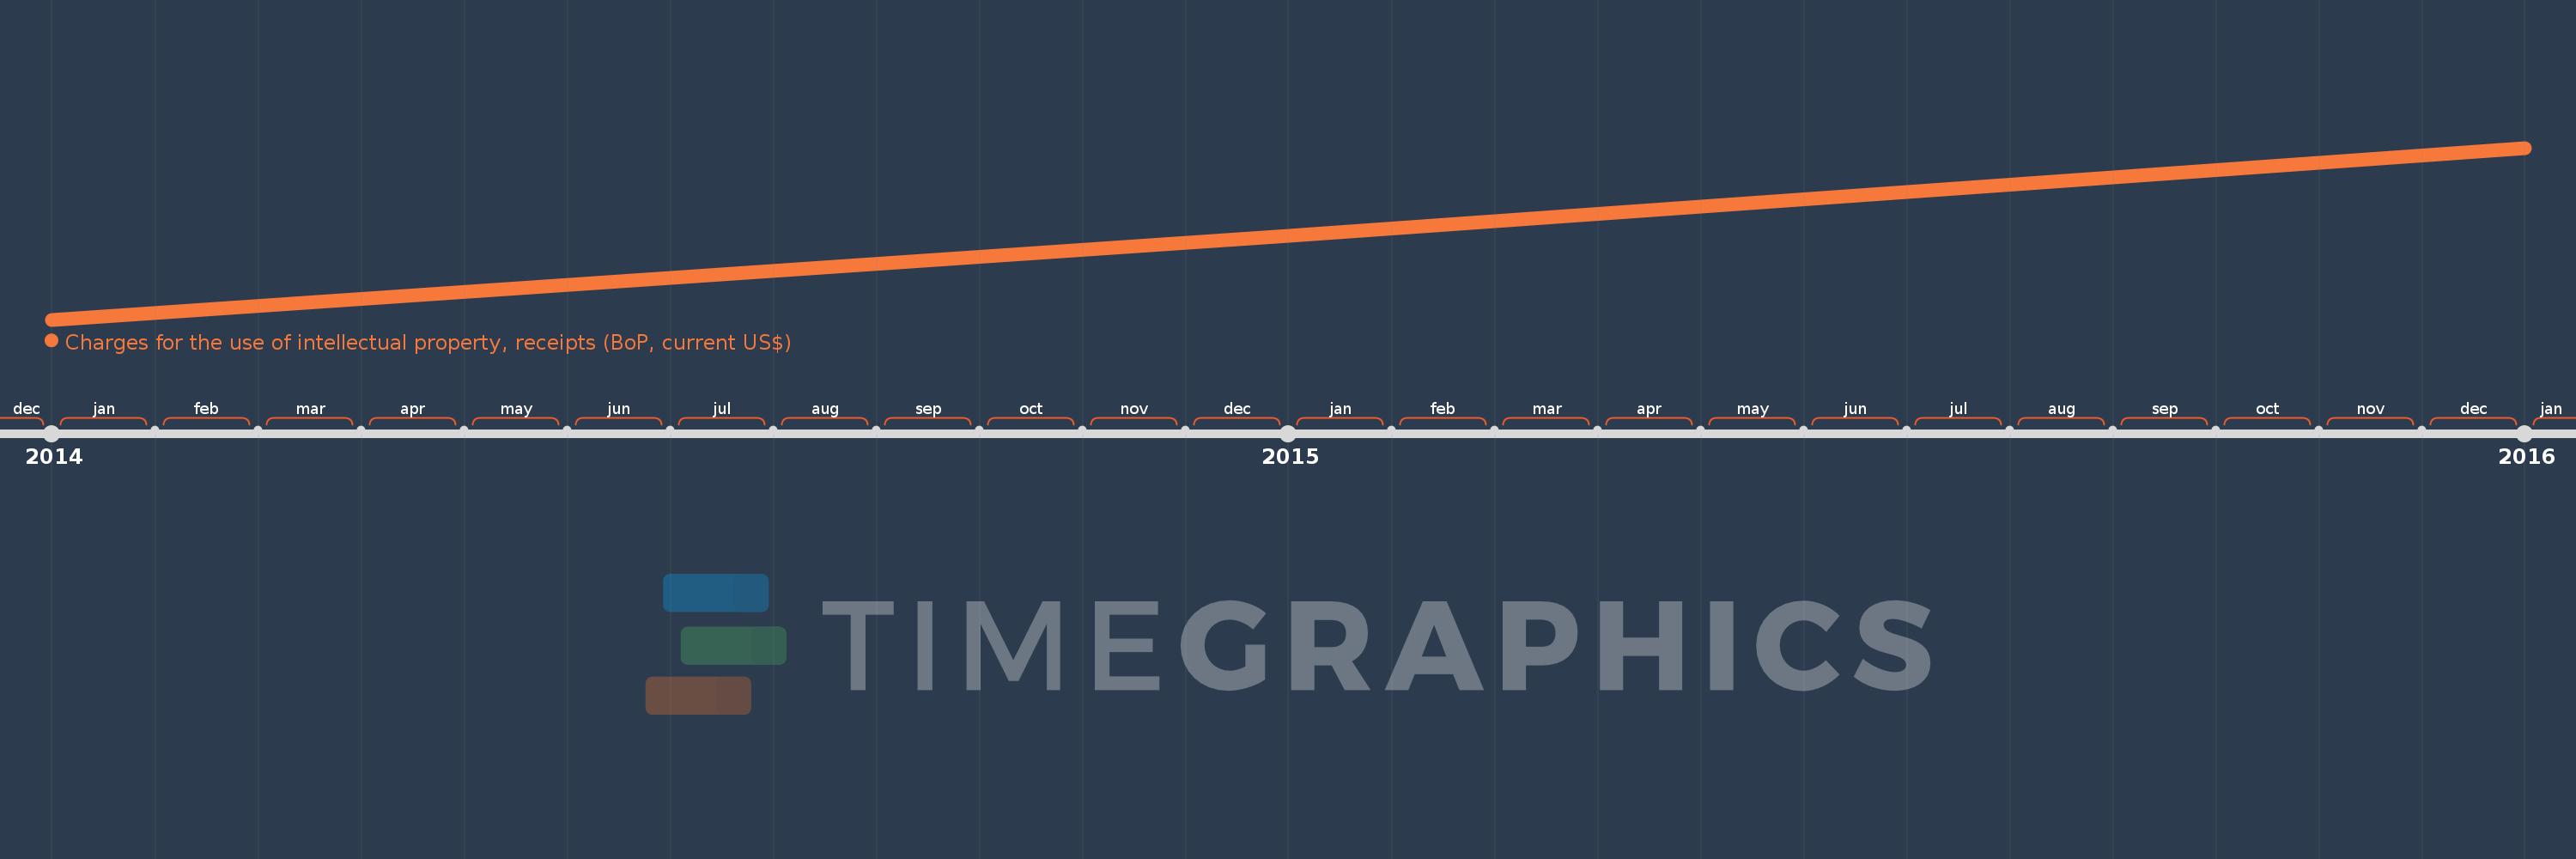
Charges for the use of intellectual property, receipts (BoP, current US$)
2016,2015,2014
This statistics in other country:
Timeline:
This timeline shows a graph from 2014 to 2016 of Iceland. No data until 2013. Number of actual observations by date: 3.
Source name:
World Development Indicators
Source organization:
International Monetary Fund, Balance of Payments Statistics Yearbook and data files.
Categories, topics:
Economy & Growth, Science & Technology
Last updated:
apr 23, 2017
Indicators value changes by year
Minimum:
91.552 mln
jan 1, 2014
Maximum:
229.625 mln
jan 1, 2016
At the date of observation
Value
Absolute change
Change from previous value
jan 1, 2014
91.552 mln
+91.552 mln
0.0%
jan 1, 2015
158.668 mln
+67.116 mln
73.31%
jan 1, 2016
229.625 mln
+70.958 mln
44.72%
Ranking of countries by current statistics by years


Comments: