29
/
en
AIzaSyAYiBZKx7MnpbEhh9jyipgxe19OcubqV5w
April 1, 2024
225664
Portugal
PRT
true
2
1
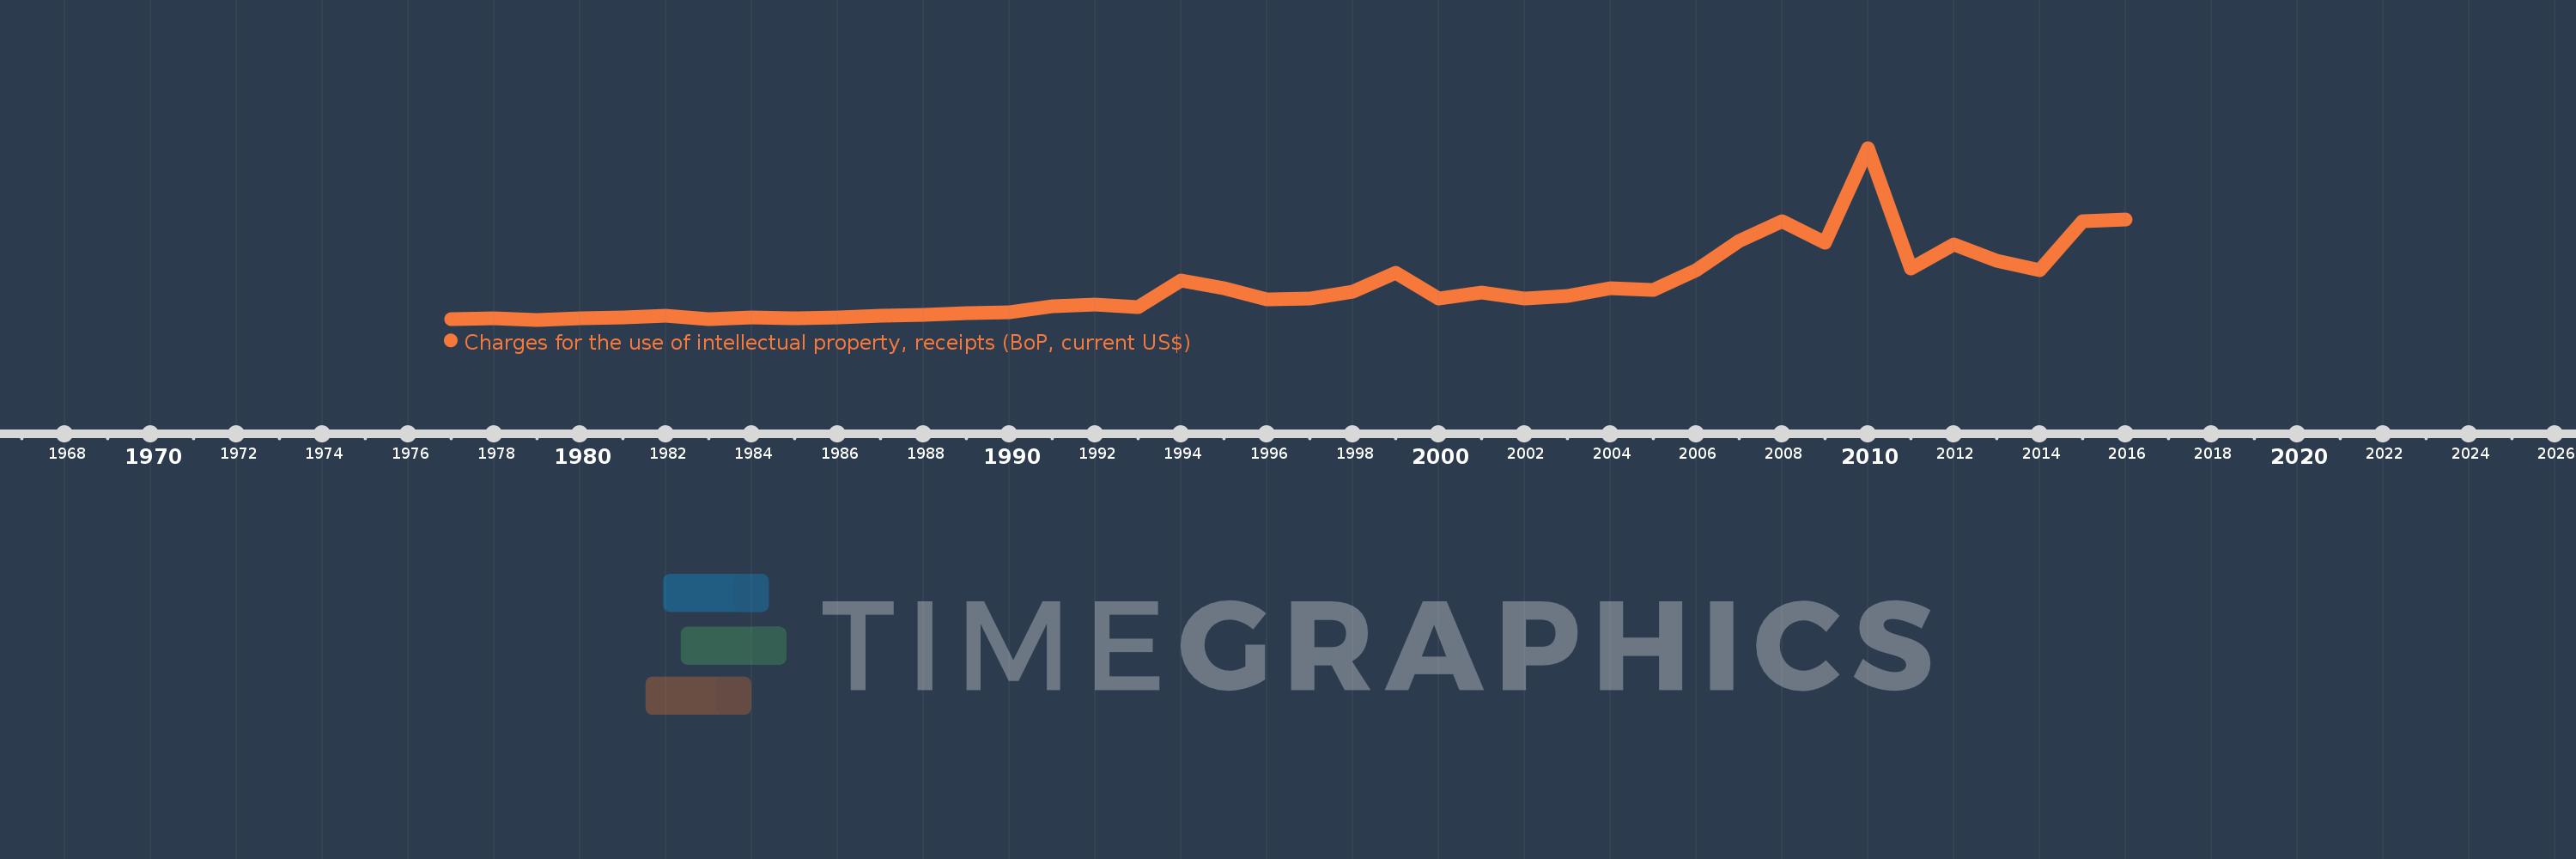
Charges for the use of intellectual property, receipts (BoP, current US$)
2016,2015,2014,2013,2012,2011,2010,2009,2008,2007,2006,2005,2004,2003,2002,2001,2000,1999,1998,1997,1996,1995,1994,1993,1992,1991,1990,1989,1988,1987,1986,1985,1984,1983,1982,1981,1980,1979,1978,1977
This statistics in other country:
Timeline:
This timeline shows a graph from 1977 to 2016 of Portugal. No data until 1976. Number of actual observations by date: 40.
Source name:
World Development Indicators
Source organization:
International Monetary Fund, Balance of Payments Statistics Yearbook and data files.
Categories, topics:
Economy & Growth, Science & Technology
Last updated:
apr 23, 2017
Indicators value changes by year
Minimum:
1.823 mln
jan 1, 1979
Maximum:
150.975 mln
jan 1, 2010
At the date of observation
Value
Absolute change
Change from previous value
jan 1, 1977
2.321 mln
+2.321 mln
0.0%
jan 1, 1978
2.9 mln
+578.512K
24.92%
jan 1, 1979
1.823 mln
-1.076 mln
-37.12%
jan 1, 1980
3.05 mln
+1.226 mln
67.26%
jan 1, 1981
3.603 mln
+553.138K
18.14%
jan 1, 1982
5.164 mln
+1.561 mln
43.33%
jan 1, 1983
2.431 mln
-2.733 mln
-52.93%
jan 1, 1984
3.769 mln
+1.338 mln
55.04%
jan 1, 1985
2.749 mln
-1.02 mln
-27.06%
jan 1, 1986
3.544 mln
+794.559K
28.9%
jan 1, 1987
5.349 mln
+1.806 mln
50.95%
jan 1, 1988
6.409 mln
+1.06 mln
19.82%
jan 1, 1989
7.67 mln
+1.26 mln
19.67%
jan 1, 1990
8.264 mln
+593.979K
7.74%
jan 1, 1991
13.519 mln
+5.255 mln
63.6%
jan 1, 1992
15.243 mln
+1.724 mln
12.75%
jan 1, 1993
12.504 mln
-2.739 mln
-17.97%
jan 1, 1994
35.853 mln
+23.348 mln
186.72%
jan 1, 1995
28.983 mln
-6.87 mln
-19.16%
jan 1, 1996
19.243 mln
-9.74 mln
-33.61%
jan 1, 1997
20.082 mln
+839.238K
4.36%
jan 1, 1998
26.512 mln
+6.43 mln
32.02%
jan 1, 1999
42.552 mln
+16.04 mln
60.5%
jan 1, 2000
20.224 mln
-22.329 mln
-52.47%
jan 1, 2001
25.348 mln
+5.125 mln
25.34%
jan 1, 2002
20.574 mln
-4.774 mln
-18.83%
jan 1, 2003
22.792 mln
+2.218 mln
10.78%
jan 1, 2004
29.443 mln
+6.651 mln
29.18%
jan 1, 2005
27.414 mln
-2.029 mln
-6.89%
jan 1, 2006
44.896 mln
+17.482 mln
63.77%
jan 1, 2007
70.388 mln
+25.492 mln
56.78%
jan 1, 2008
87.7 mln
+17.311 mln
24.59%
jan 1, 2009
68.792 mln
-18.908 mln
-21.56%
jan 1, 2010
150.975 mln
+82.183 mln
119.47%
jan 1, 2011
46.385 mln
-104.59 mln
-69.28%
jan 1, 2012
66.961 mln
+20.576 mln
44.36%
jan 1, 2013
52.806 mln
-14.156 mln
-21.14%
jan 1, 2014
45.192 mln
-7.614 mln
-14.42%
jan 1, 2015
87.374 mln
+42.182 mln
93.34%
jan 1, 2016
88.728 mln
+1.354 mln
1.55%
Ranking of countries by current statistics by years


Comments: