29
/
en
AIzaSyAYiBZKx7MnpbEhh9jyipgxe19OcubqV5w
April 1, 2024
26337
Early-demographic dividend
EAR
false
2
1
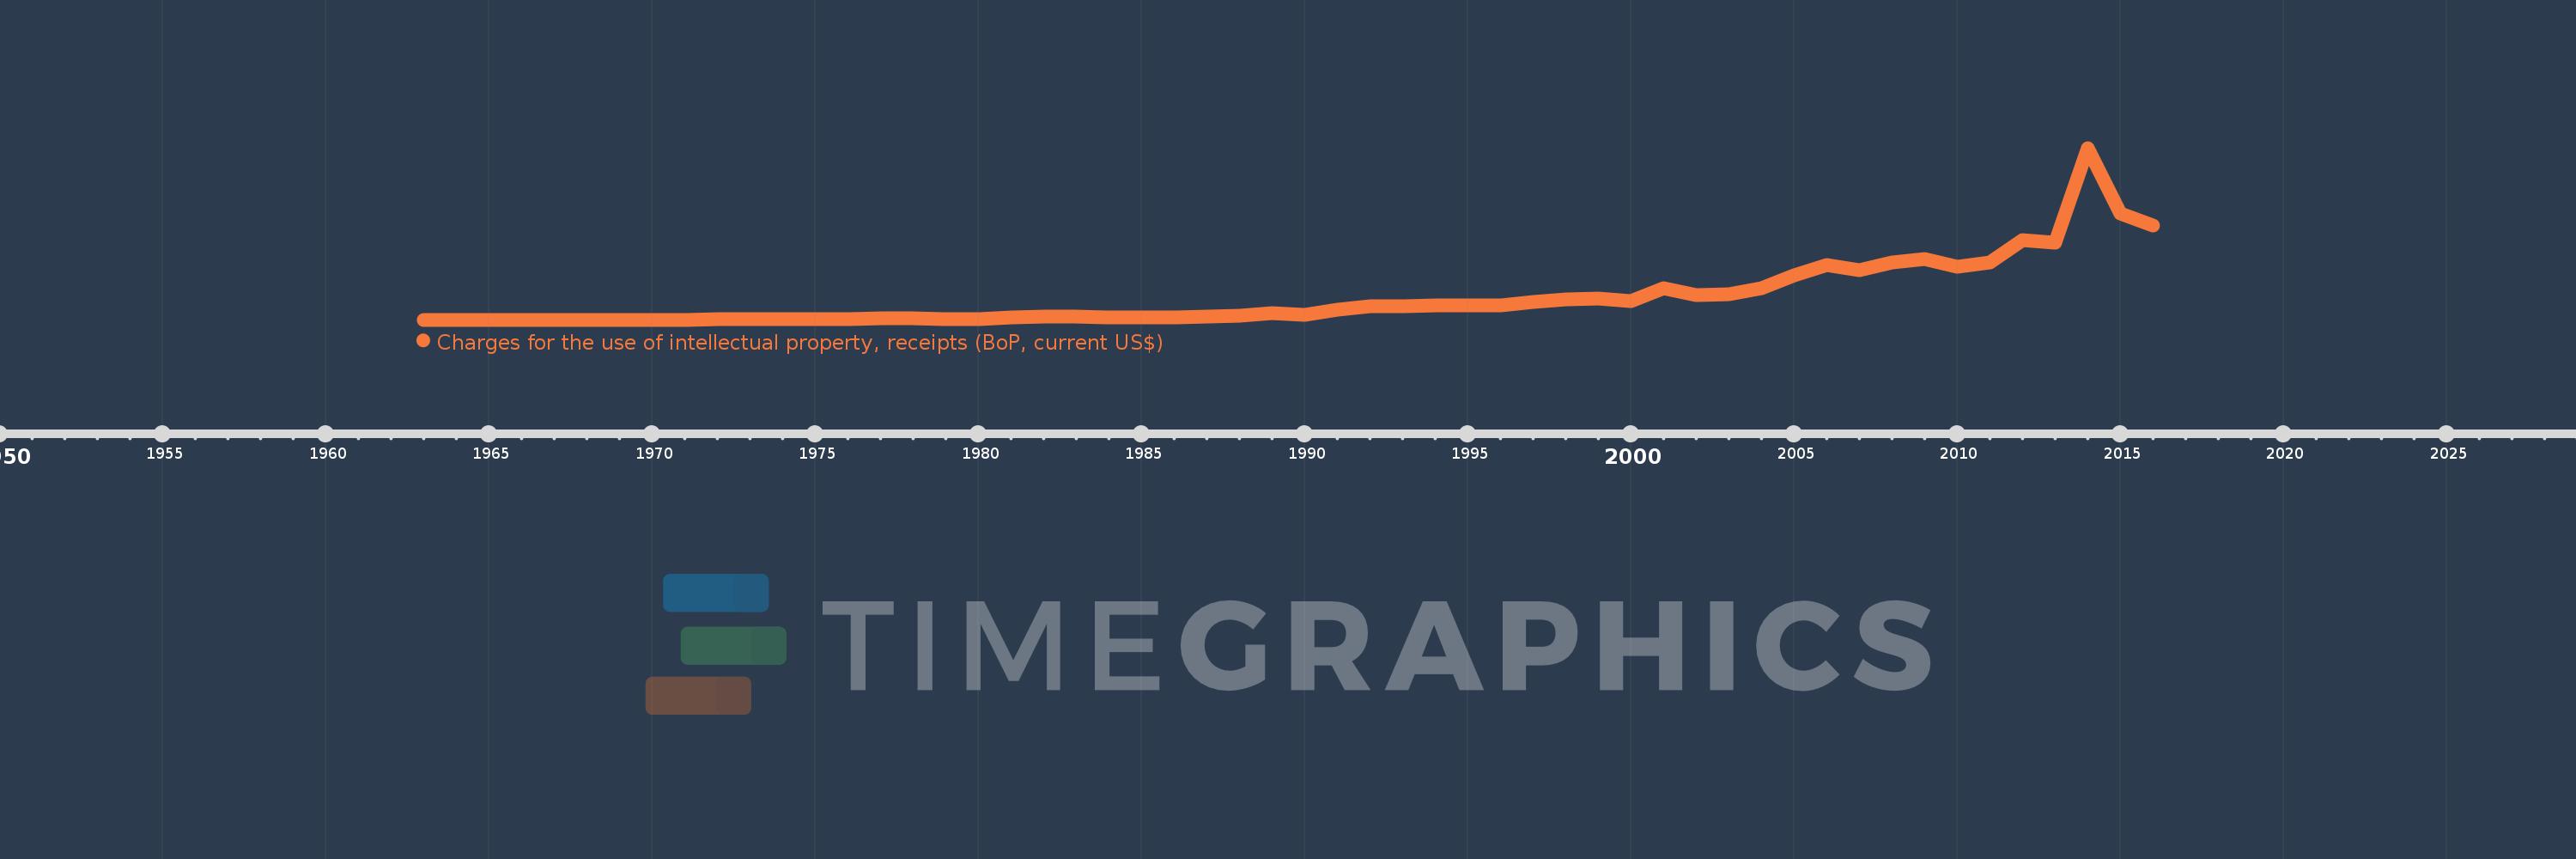
Charges for the use of intellectual property, receipts (BoP, current US$)
2016,2015,2014,2013,2012,2011,2010,2009,2008,2007,2006,2005,2004,2003,2002,2001,2000,1999,1998,1997,1996,1995,1994,1993,1992,1991,1990,1989,1988,1987,1986,1985,1984,1983,1982,1981,1980,1979,1978,1977,1976,1975,1974,1973,1972,1971,1970,1969,1968,1967,1966,1965,1964,1963
This statistics in other country:
Timeline:
This timeline shows a graph from 1963 to 2016 of Early-demographic dividend. No data until 1962. Number of actual observations by date: 54.
Source name:
World Development Indicators
Source organization:
International Monetary Fund, Balance of Payments Statistics Yearbook and data files.
Categories, topics:
Economy & Growth, Science & Technology
Last updated:
apr 23, 2017
Indicators value changes by year
Minimum:
1.4 mln
jan 1, 1964
Maximum:
4.352 bln
jan 1, 2014
At the date of observation
Value
Absolute change
Change from previous value
jan 1, 1963
2.8 mln
+2.8 mln
0.0%
jan 1, 1964
1.4 mln
-1.4 mln
-50.0%
jan 1, 1965
2.8 mln
+1.4 mln
100.0%
jan 1, 1966
2.8 mln
0.0
0.0%
jan 1, 1967
2.8 mln
0.0
0.0%
jan 1, 1968
4.2 mln
+1.4 mln
50.0%
jan 1, 1969
5.6 mln
+1.4 mln
33.33%
jan 1, 1970
2.8 mln
-2.8 mln
-50.0%
jan 1, 1971
4.2 mln
+1.4 mln
50.0%
jan 1, 1972
6.985 mln
+2.785 mln
66.32%
jan 1, 1973
10.252 mln
+3.267 mln
46.76%
jan 1, 1974
5.773 mln
-4.479 mln
-43.69%
jan 1, 1975
11.378 mln
+5.605 mln
97.09%
jan 1, 1976
13.305 mln
+1.927 mln
16.94%
jan 1, 1977
43.05 mln
+29.745 mln
223.56%
jan 1, 1978
38.598 mln
-4.452 mln
-10.34%
jan 1, 1979
24.178 mln
-14.42 mln
-37.36%
jan 1, 1980
26.953 mln
+2.775 mln
11.48%
jan 1, 1981
57.536 mln
+30.583 mln
113.46%
jan 1, 1982
73.732 mln
+16.196 mln
28.15%
jan 1, 1983
76.914 mln
+3.182 mln
4.32%
jan 1, 1984
59.495 mln
-17.419 mln
-22.65%
jan 1, 1985
60.031 mln
+535.425K
0.9%
jan 1, 1986
67.822 mln
+7.791 mln
12.98%
jan 1, 1987
85.957 mln
+18.136 mln
26.74%
jan 1, 1988
95.459 mln
+9.501 mln
11.05%
jan 1, 1989
171.232 mln
+75.773 mln
79.38%
jan 1, 1990
120.754 mln
-50.478 mln
-29.48%
jan 1, 1991
248.23 mln
+127.476 mln
105.57%
jan 1, 1992
336.833 mln
+88.603 mln
35.69%
jan 1, 1993
338.212 mln
+1.379 mln
0.41%
jan 1, 1994
355.676 mln
+17.464 mln
5.16%
jan 1, 1995
368.789 mln
+13.113 mln
3.69%
jan 1, 1996
365.07 mln
-3.719 mln
-1.01%
jan 1, 1997
456.458 mln
+91.388 mln
25.03%
jan 1, 1998
524.269 mln
+67.811 mln
14.86%
jan 1, 1999
537.561 mln
+13.292 mln
2.54%
jan 1, 2000
472.72 mln
-64.842 mln
-12.06%
jan 1, 2001
792.731 mln
+320.012 mln
67.7%
jan 1, 2002
635.823 mln
-156.908 mln
-19.79%
jan 1, 2003
656.598 mln
+20.775 mln
3.27%
jan 1, 2004
804.74 mln
+148.143 mln
22.56%
jan 1, 2005
1.116 bln
+311.371 mln
38.69%
jan 1, 2006
1.391 bln
+274.791 mln
24.62%
jan 1, 2007
1.255 bln
-136.12 mln
-9.79%
jan 1, 2008
1.448 bln
+192.73 mln
15.36%
jan 1, 2009
1.533 bln
+85.772 mln
5.93%
jan 1, 2010
1.339 bln
-194.345 mln
-12.68%
jan 1, 2011
1.443 bln
+104.418 mln
7.8%
jan 1, 2012
2.008 bln
+564.323 mln
39.1%
jan 1, 2013
1.954 bln
-53.695 mln
-2.67%
jan 1, 2014
4.352 bln
+2.398 bln
122.75%
jan 1, 2015
2.697 bln
-1.655 bln
-38.03%
jan 1, 2016
2.393 bln
-304.495 mln
-11.29%
Ranking of countries by current statistics by years


Comments: