29
/
en
AIzaSyAYiBZKx7MnpbEhh9jyipgxe19OcubqV5w
April 1, 2024
52450
OECD members
OED
false
2
1
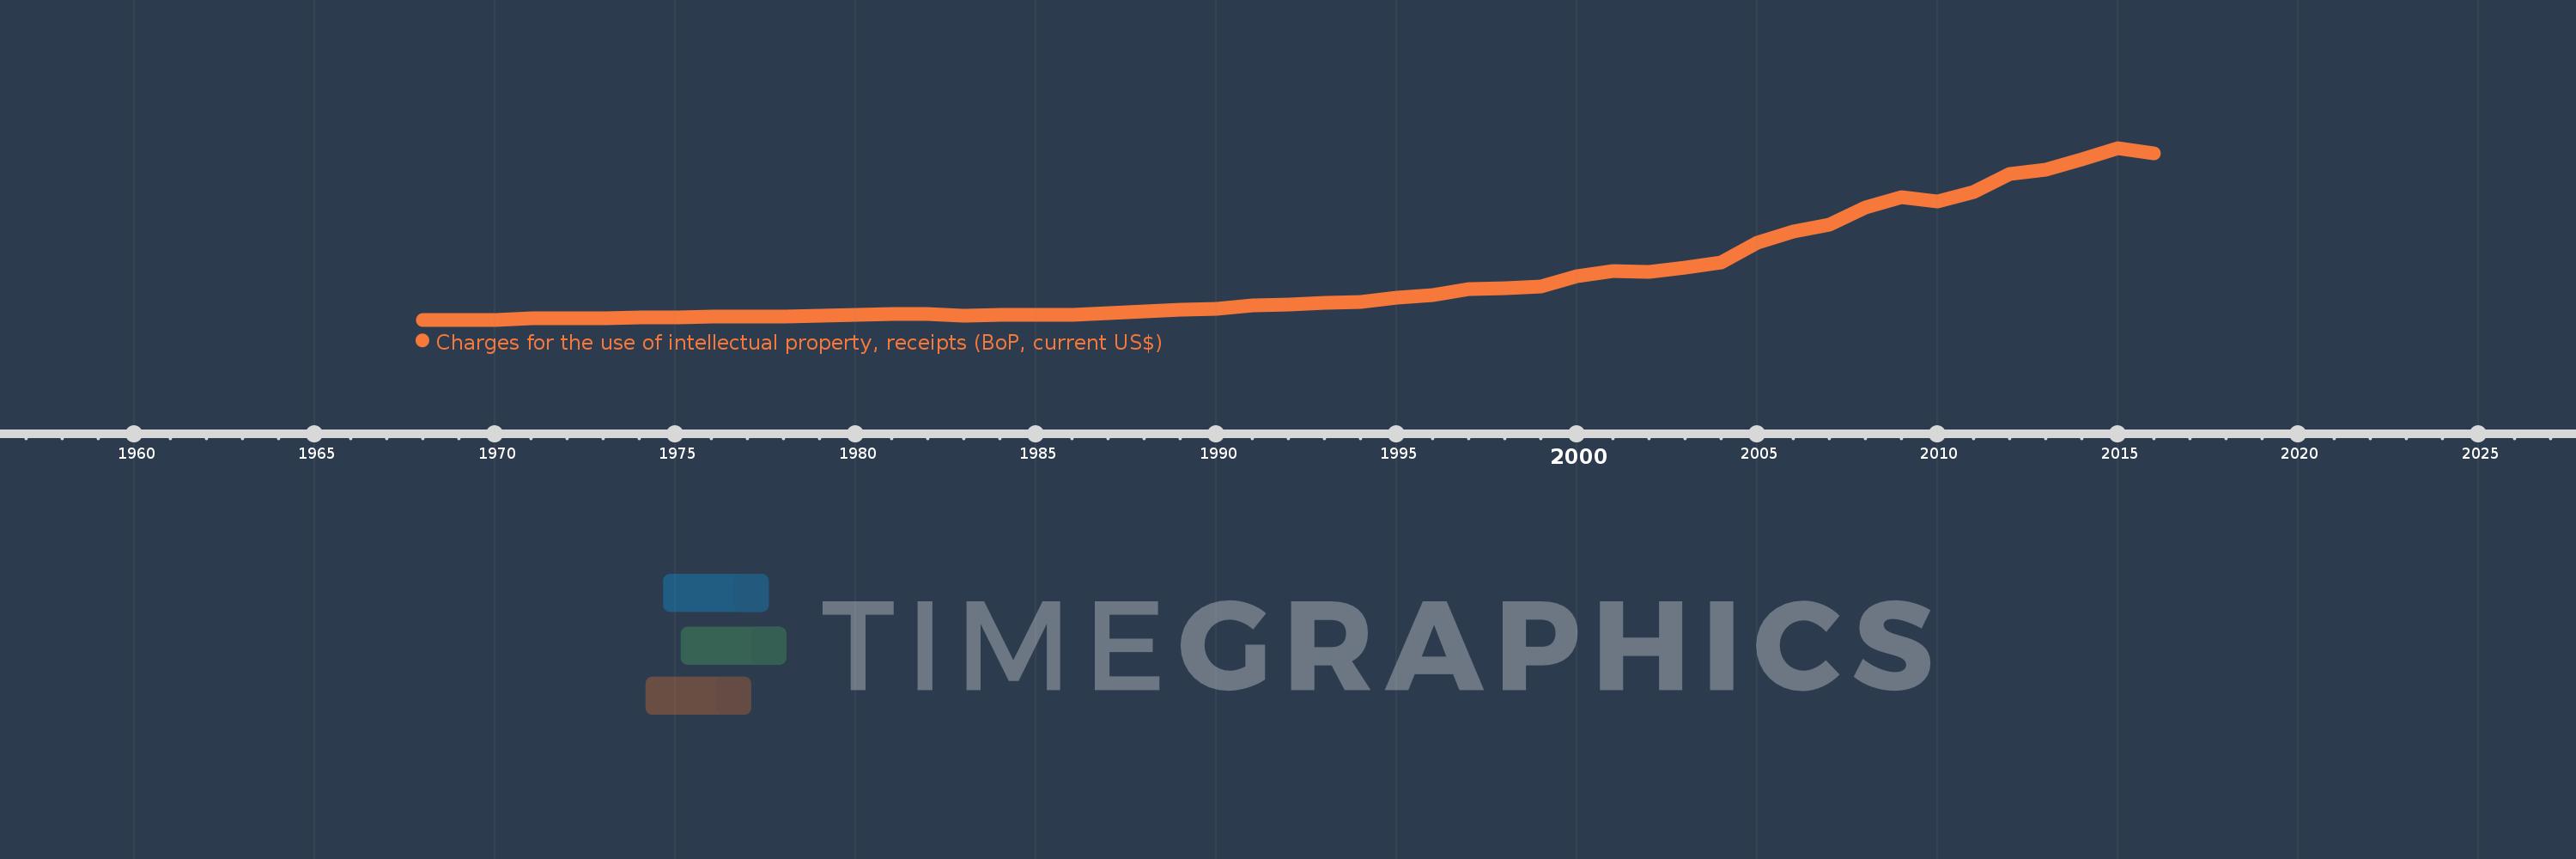
Charges for the use of intellectual property, receipts (BoP, current US$)
2016,2015,2014,2013,2012,2011,2010,2009,2008,2007,2006,2005,2004,2003,2002,2001,2000,1999,1998,1997,1996,1995,1994,1993,1992,1991,1990,1989,1988,1987,1986,1985,1984,1983,1982,1981,1980,1979,1978,1977,1976,1975,1974,1973,1972,1971,1970,1969,1968
This statistics in other country:
Timeline:
This timeline shows a graph from 1968 to 2016 of OECD members. No data until 1967. Number of actual observations by date: 49.
Source name:
World Development Indicators
Source organization:
International Monetary Fund, Balance of Payments Statistics Yearbook and data files.
Categories, topics:
Economy & Growth, Science & Technology
Last updated:
apr 23, 2017
Indicators value changes by year
Minimum:
58.84 mln
jan 1, 1969
Maximum:
320.396 bln
jan 1, 2015
At the date of observation
Value
Absolute change
Change from previous value
jan 1, 1968
64.641 mln
+64.641 mln
0.0%
jan 1, 1969
58.84 mln
-5.801 mln
-8.97%
jan 1, 1970
82.873 mln
+24.033 mln
40.85%
jan 1, 1971
2.788 bln
+2.705 bln
3.26K%
jan 1, 1972
3.19 bln
+402.612 mln
14.44%
jan 1, 1973
3.535 bln
+345.143 mln
10.82%
jan 1, 1974
4.136 bln
+600.425 mln
16.98%
jan 1, 1975
4.882 bln
+746.539 mln
18.05%
jan 1, 1976
5.732 bln
+849.344 mln
17.4%
jan 1, 1977
5.929 bln
+197.283 mln
3.44%
jan 1, 1978
6.705 bln
+776.455 mln
13.1%
jan 1, 1979
8.057 bln
+1.351 bln
20.15%
jan 1, 1980
8.798 bln
+741.065 mln
9.2%
jan 1, 1981
10.111 bln
+1.313 bln
14.92%
jan 1, 1982
10.253 bln
+142.513 mln
1.41%
jan 1, 1983
8.18 bln
-2.073 bln
-20.22%
jan 1, 1984
8.749 bln
+568.433 mln
6.95%
jan 1, 1985
8.831 bln
+82.424 mln
0.94%
jan 1, 1986
9.625 bln
+793.763 mln
8.99%
jan 1, 1987
11.843 bln
+2.218 bln
23.05%
jan 1, 1988
15.633 bln
+3.789 bln
32.0%
jan 1, 1989
18.636 bln
+3.003 bln
19.21%
jan 1, 1990
20.87 bln
+2.233 bln
11.98%
jan 1, 1991
26.573 bln
+5.704 bln
27.33%
jan 1, 1992
27.82 bln
+1.247 bln
4.69%
jan 1, 1993
32.35 bln
+4.53 bln
16.28%
jan 1, 1994
33.802 bln
+1.451 bln
4.49%
jan 1, 1995
40.99 bln
+7.189 bln
21.27%
jan 1, 1996
46.639 bln
+5.649 bln
13.78%
jan 1, 1997
56.577 bln
+9.938 bln
21.31%
jan 1, 1998
58.506 bln
+1.929 bln
3.41%
jan 1, 1999
62.734 bln
+4.227 bln
7.23%
jan 1, 2000
80.574 bln
+17.84 bln
28.44%
jan 1, 2001
90.362 bln
+9.788 bln
12.15%
jan 1, 2002
89.351 bln
-1.011 bln
-1.12%
jan 1, 2003
96.754 bln
+7.404 bln
8.29%
jan 1, 2004
106.237 bln
+9.482 bln
9.8%
jan 1, 2005
144.411 bln
+38.174 bln
35.93%
jan 1, 2006
164.298 bln
+19.887 bln
13.77%
jan 1, 2007
177.147 bln
+12.849 bln
7.82%
jan 1, 2008
210.008 bln
+32.86 bln
18.55%
jan 1, 2009
228.994 bln
+18.986 bln
9.04%
jan 1, 2010
219.811 bln
-9.182 bln
-4.01%
jan 1, 2011
238.678 bln
+18.866 bln
8.58%
jan 1, 2012
272.141 bln
+33.463 bln
14.02%
jan 1, 2013
279.112 bln
+6.971 bln
2.56%
jan 1, 2014
298.378 bln
+19.266 bln
6.9%
jan 1, 2015
320.396 bln
+22.018 bln
7.38%
jan 1, 2016
311.03 bln
-9.366 bln
-2.92%
Ranking of countries by current statistics by years


Comments: