29
/
en
AIzaSyAYiBZKx7MnpbEhh9jyipgxe19OcubqV5w
April 1, 2024
167181
Kenya
KEN
true
2
1
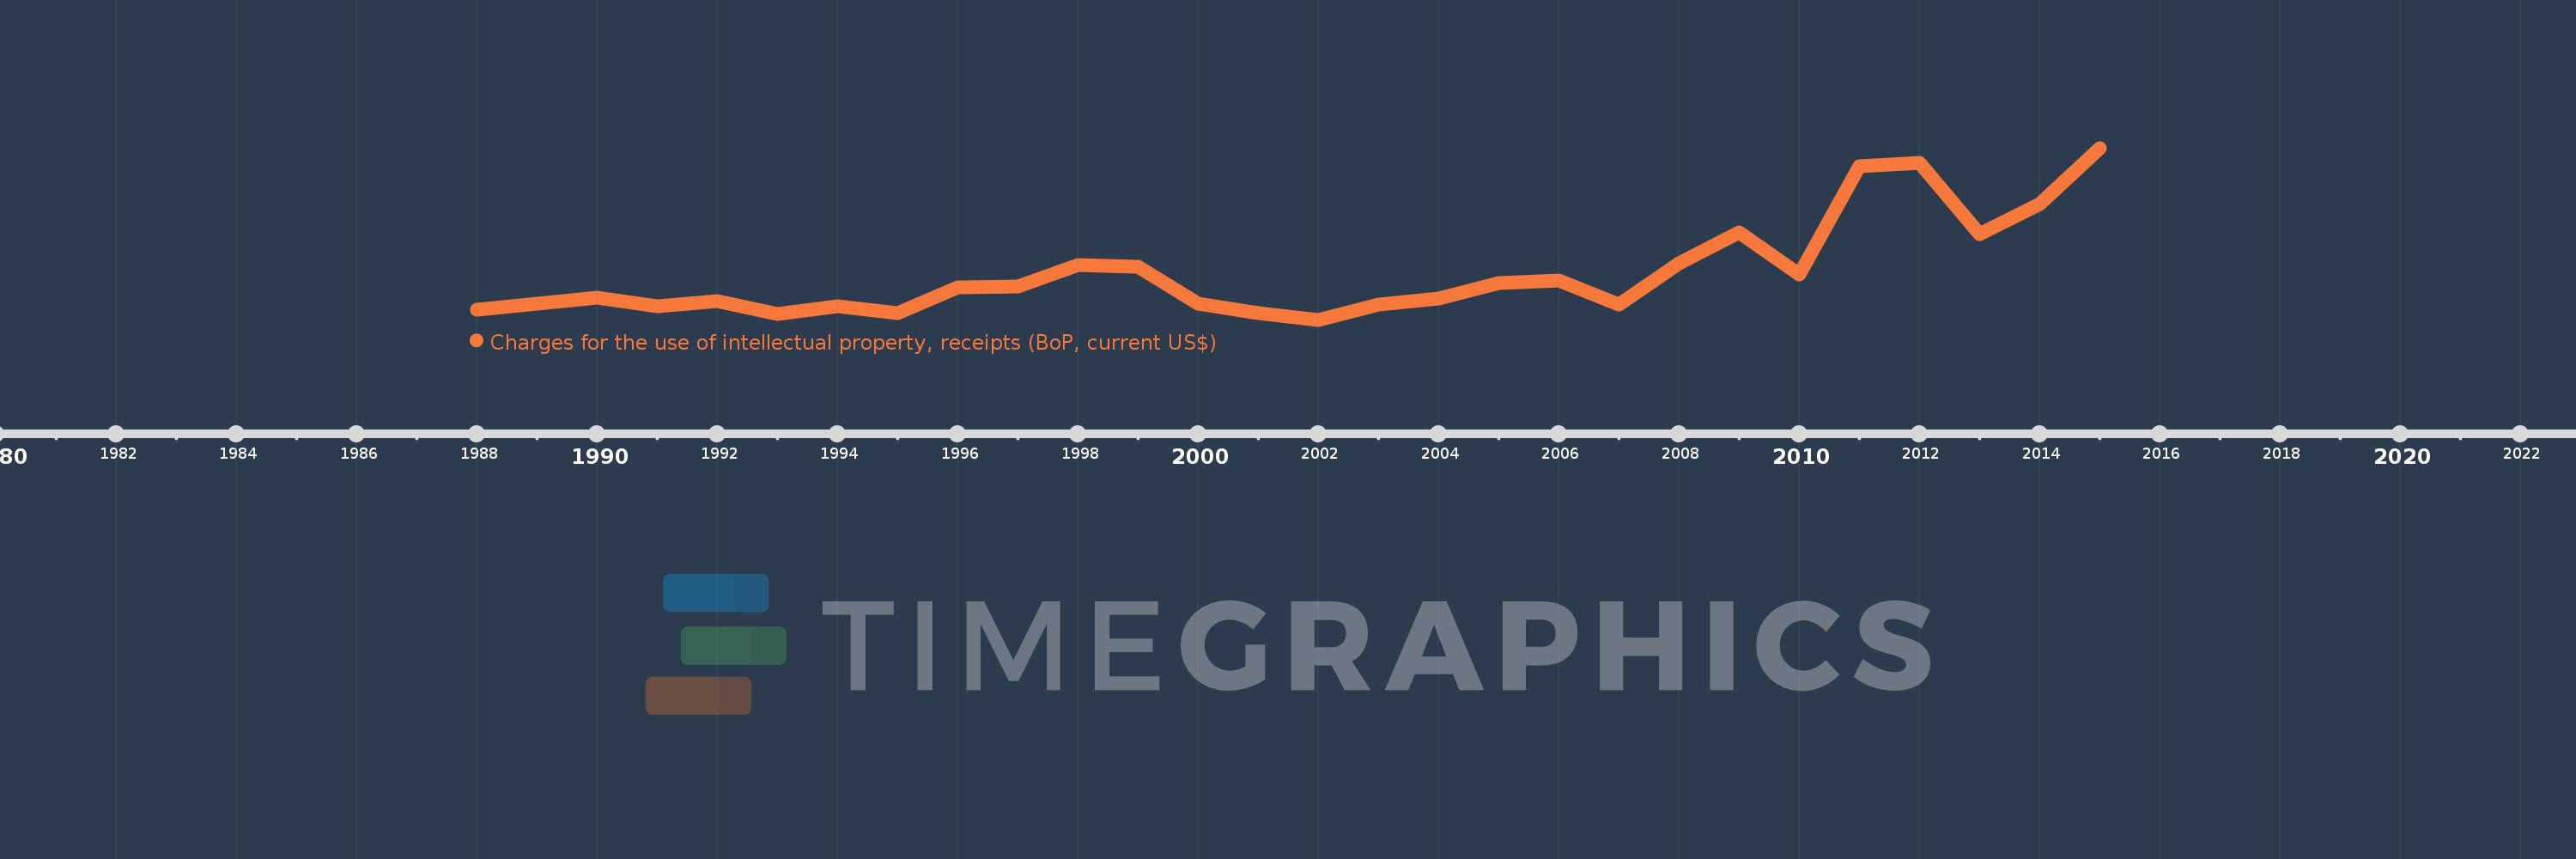
Charges for the use of intellectual property, receipts (BoP, current US$)
2015,2014,2013,2012,2011,2010,2009,2008,2007,2006,2005,2004,2003,2002,2001,2000,1999,1998,1997,1996,1995,1994,1993,1992,1991,1990,1988
This statistics in other country:
Timeline:
This timeline shows a graph from 1988 to 2015 of Kenya. No data until 1987. Number of actual observations by date: 27.
Source name:
World Development Indicators
Source organization:
International Monetary Fund, Balance of Payments Statistics Yearbook and data files.
Categories, topics:
Economy & Growth, Science & Technology
Last updated:
apr 23, 2017
Indicators value changes by year
Minimum:
5.026 mln
jan 1, 2002
Maximum:
59.652 mln
jan 1, 2015
At the date of observation
Value
Absolute change
Change from previous value
jan 1, 1988
8.265 mln
+8.265 mln
0.0%
jan 1, 1990
12.104 mln
+3.838 mln
46.44%
jan 1, 1991
9.426 mln
-2.677 mln
-22.12%
jan 1, 1992
11.066 mln
+1.64 mln
17.39%
jan 1, 1993
6.953 mln
-4.113 mln
-37.17%
jan 1, 1994
9.281 mln
+2.328 mln
33.48%
jan 1, 1995
7.044 mln
-2.237 mln
-24.1%
jan 1, 1996
15.225 mln
+8.181 mln
116.15%
jan 1, 1997
15.48 mln
+255.018K
1.67%
jan 1, 1998
22.42 mln
+6.94 mln
44.83%
jan 1, 1999
21.904 mln
-516.082K
-2.3%
jan 1, 2000
10.139 mln
-11.765 mln
-53.71%
jan 1, 2001
7.067 mln
-3.072 mln
-30.3%
jan 1, 2002
5.026 mln
-2.041 mln
-28.88%
jan 1, 2003
9.943 mln
+4.918 mln
97.86%
jan 1, 2004
11.644 mln
+1.7 mln
17.1%
jan 1, 2005
16.632 mln
+4.988 mln
42.84%
jan 1, 2006
17.501 mln
+869.61K
5.23%
jan 1, 2007
9.889 mln
-7.612 mln
-43.49%
jan 1, 2008
23.042 mln
+13.152 mln
132.99%
jan 1, 2009
32.831 mln
+9.789 mln
42.49%
jan 1, 2010
19.483 mln
-13.348 mln
-40.66%
jan 1, 2011
53.797 mln
+34.314 mln
176.12%
jan 1, 2012
55.003 mln
+1.206 mln
2.24%
jan 1, 2013
32.122 mln
-22.881 mln
-41.6%
jan 1, 2014
41.728 mln
+9.606 mln
29.9%
jan 1, 2015
59.652 mln
+17.924 mln
42.95%
Ranking of countries by current statistics by years


Comments: