29
/
en
AIzaSyAYiBZKx7MnpbEhh9jyipgxe19OcubqV5w
April 1, 2024
240257
Singapore
SGP
true
2
1
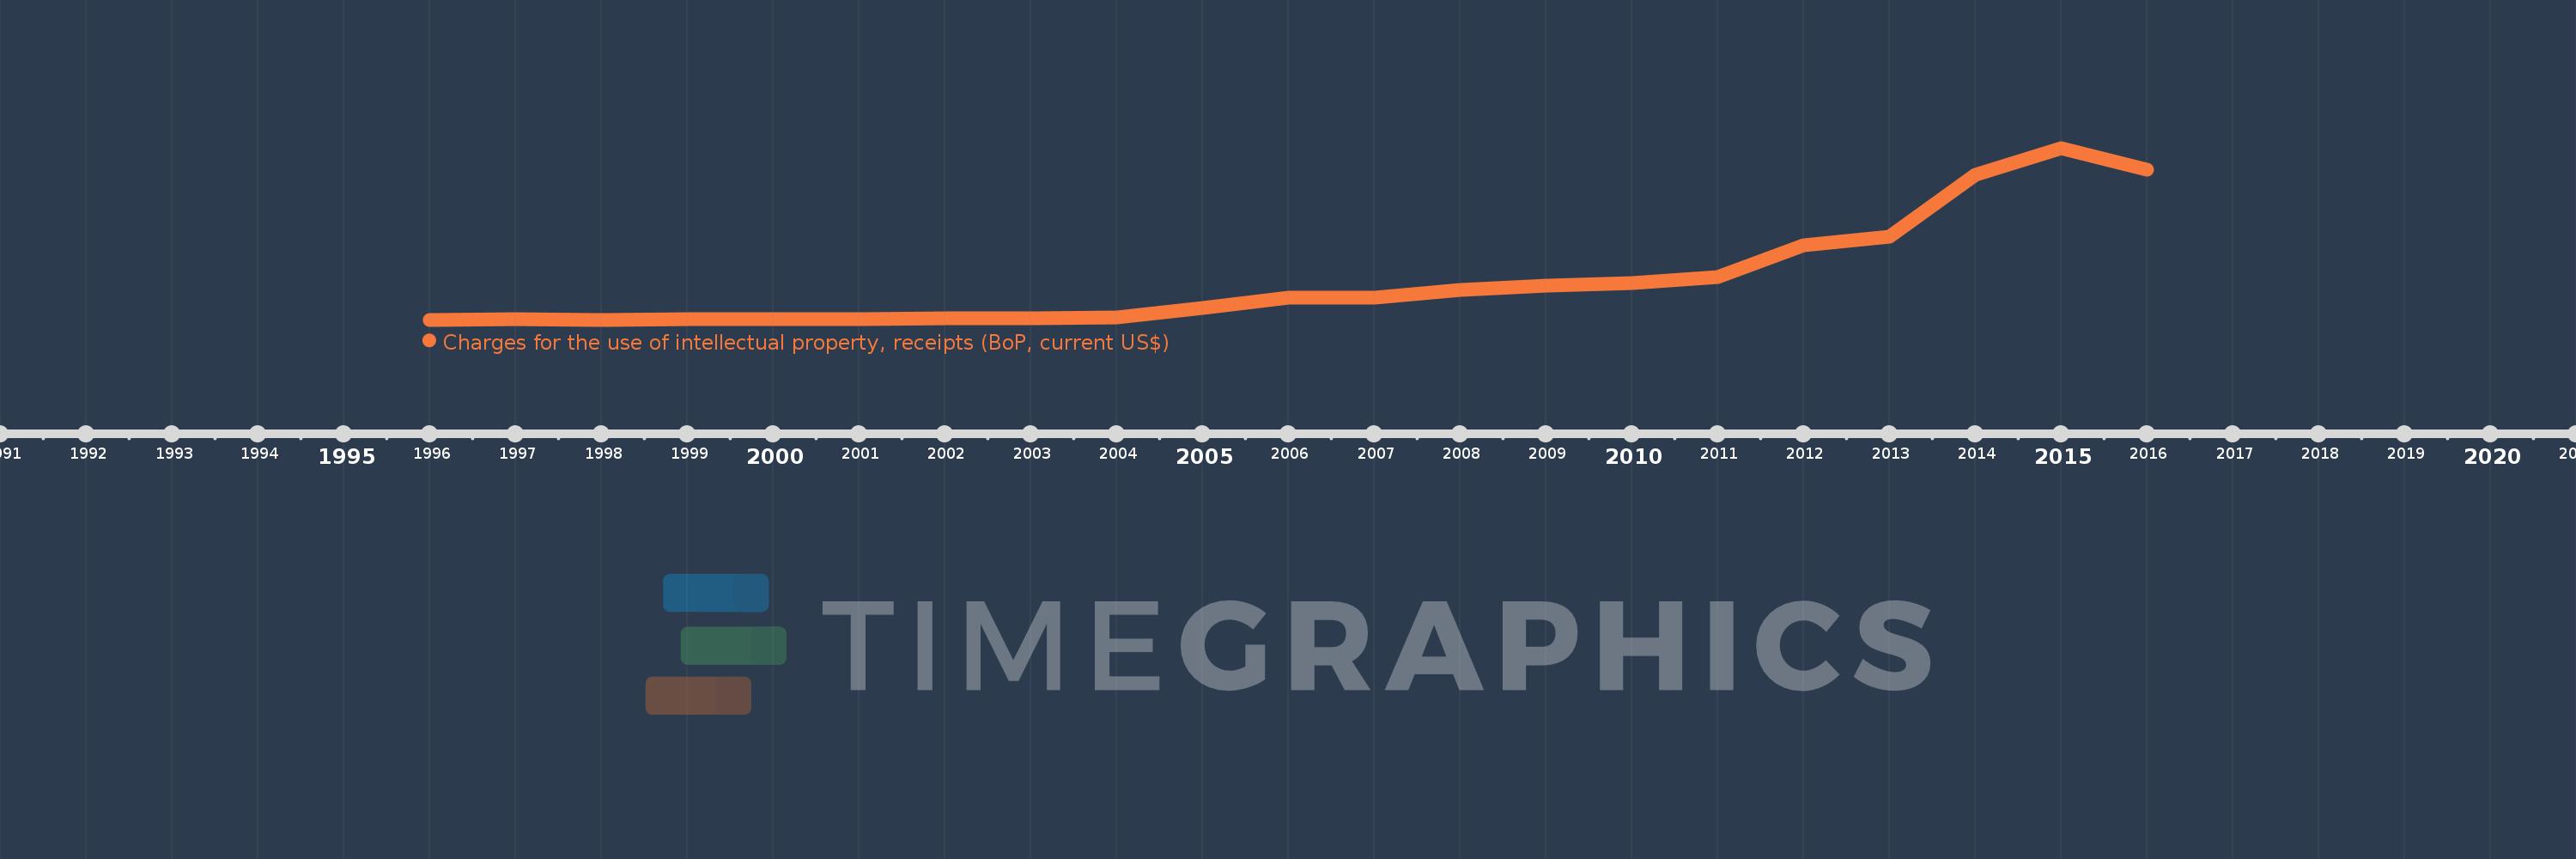
Charges for the use of intellectual property, receipts (BoP, current US$)
2016,2015,2014,2013,2012,2011,2010,2009,2008,2007,2006,2005,2004,2003,2002,2001,2000,1999,1998,1997,1996
This statistics in other country:
Timeline:
This timeline shows a graph from 1996 to 2016 of Singapore. No data until 1995. Number of actual observations by date: 21.
Source name:
World Development Indicators
Source organization:
International Monetary Fund, Balance of Payments Statistics Yearbook and data files.
Categories, topics:
Economy & Growth, Science & Technology
Last updated:
apr 23, 2017
Indicators value changes by year
Minimum:
43.305 mln
jan 1, 1998
Maximum:
3.779 bln
jan 1, 2015
At the date of observation
Value
Absolute change
Change from previous value
jan 1, 1996
44.801 mln
+44.801 mln
0.0%
jan 1, 1997
51.559 mln
+6.758 mln
15.08%
jan 1, 1998
43.305 mln
-8.253 mln
-16.01%
jan 1, 1999
48.458 mln
+5.153 mln
11.9%
jan 1, 2000
52.686 mln
+4.227 mln
8.72%
jan 1, 2001
61.428 mln
+8.743 mln
16.59%
jan 1, 2002
70.491 mln
+9.063 mln
14.75%
jan 1, 2003
74.501 mln
+4.01 mln
5.69%
jan 1, 2004
95.283 mln
+20.782 mln
27.9%
jan 1, 2005
303.805 mln
+208.522 mln
218.85%
jan 1, 2006
516.103 mln
+212.298 mln
69.88%
jan 1, 2007
529.789 mln
+13.687 mln
2.65%
jan 1, 2008
697.829 mln
+168.04 mln
31.72%
jan 1, 2009
784.176 mln
+86.347 mln
12.37%
jan 1, 2010
842.343 mln
+58.167 mln
7.42%
jan 1, 2011
975.645 mln
+133.302 mln
15.83%
jan 1, 2012
1.662 bln
+686.018 mln
70.31%
jan 1, 2013
1.857 bln
+195.218 mln
11.75%
jan 1, 2014
3.185 bln
+1.328 bln
71.53%
jan 1, 2015
3.779 bln
+593.848 mln
18.64%
jan 1, 2016
3.302 bln
-476.915 mln
-12.62%
Ranking of countries by current statistics by years


Comments: