29
/
en
AIzaSyAYiBZKx7MnpbEhh9jyipgxe19OcubqV5w
April 1, 2024
100894
Canada
CAN
true
2
1
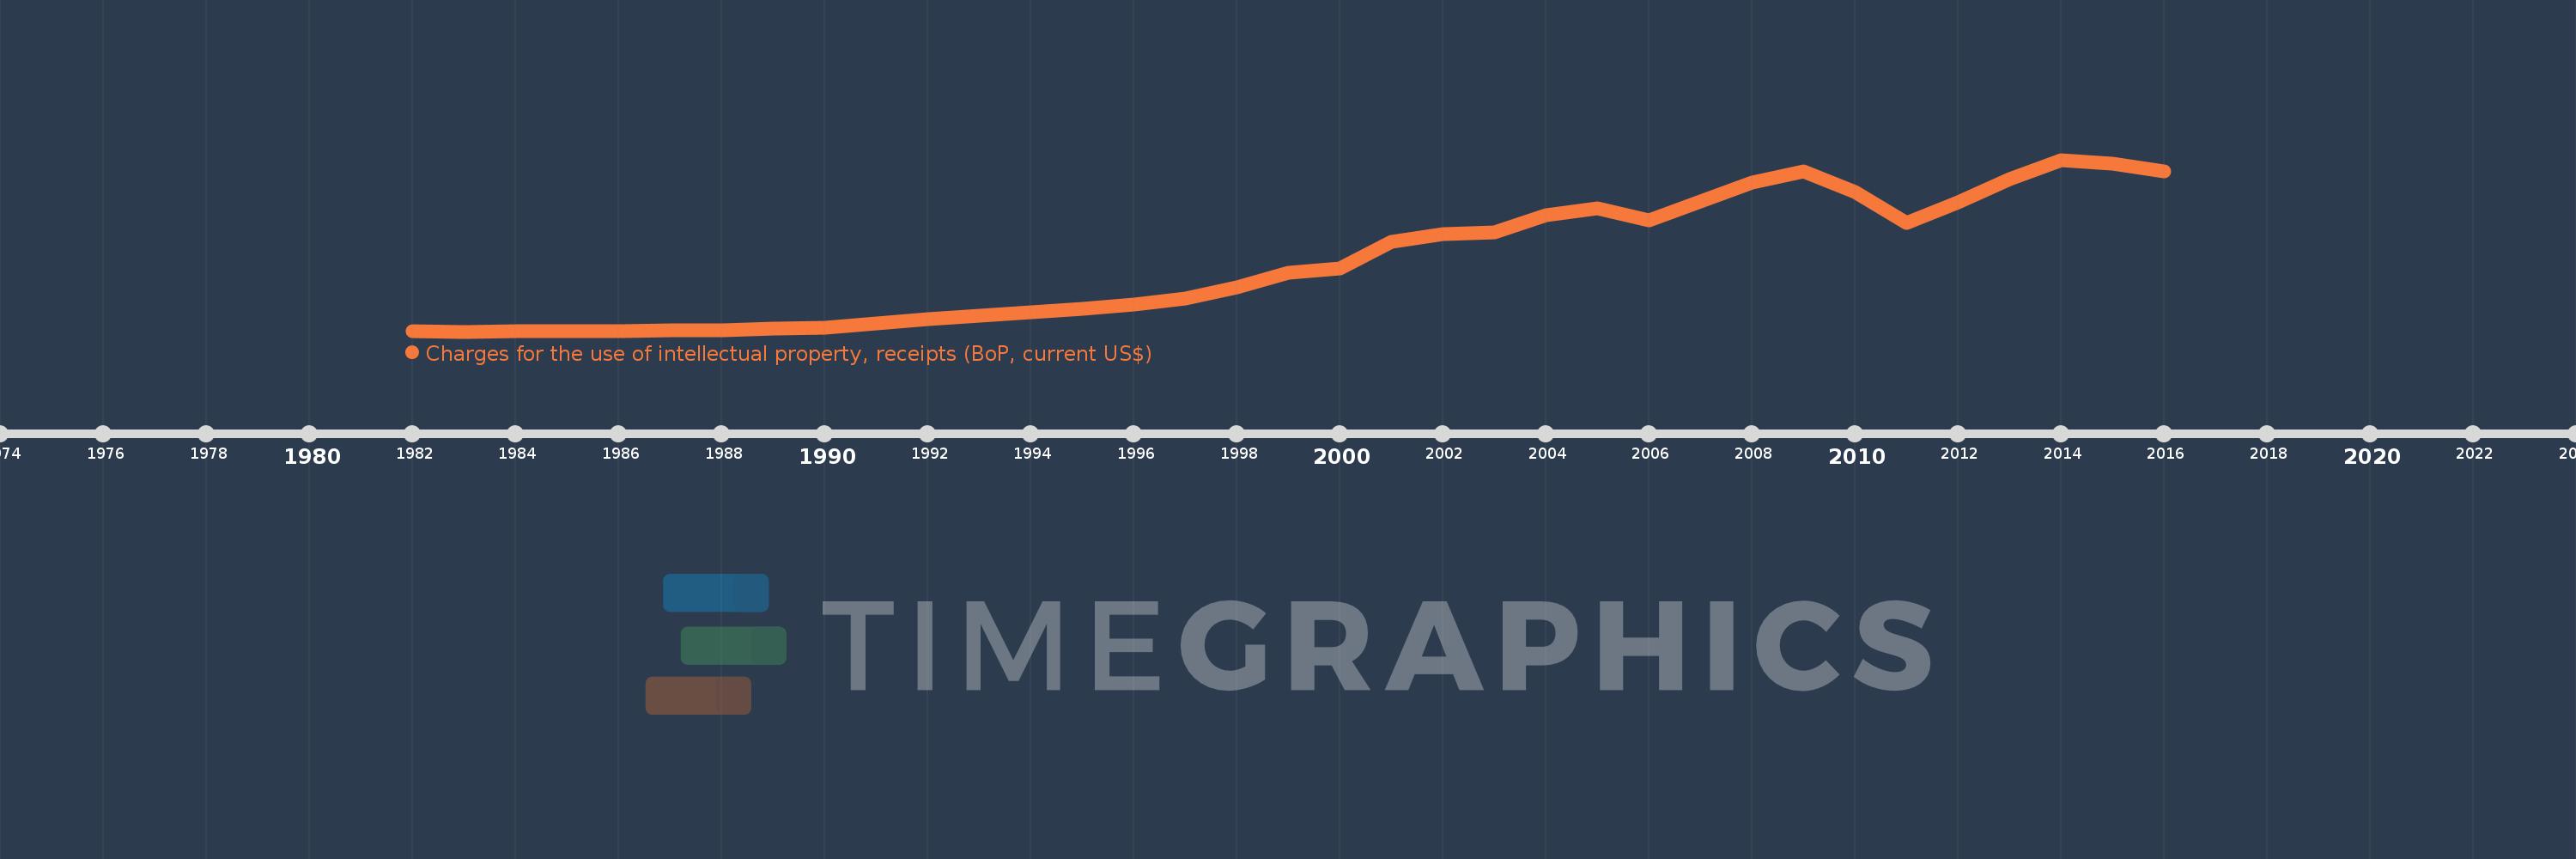
Charges for the use of intellectual property, receipts (BoP, current US$)
2016,2015,2014,2013,2012,2011,2010,2009,2008,2007,2006,2005,2004,2003,2002,2001,2000,1999,1998,1997,1996,1995,1994,1993,1992,1991,1990,1989,1988,1987,1986,1985,1984,1983,1982
This statistics in other country:
Timeline:
This timeline shows a graph from 1982 to 2016 of Canada. No data until 1981. Number of actual observations by date: 35.
Source name:
World Development Indicators
Source organization:
International Monetary Fund, Balance of Payments Statistics Yearbook and data files.
Categories, topics:
Economy & Growth, Science & Technology
Last updated:
apr 23, 2017
Indicators value changes by year
Minimum:
32.396 mln
jan 1, 1983
Maximum:
4.426 bln
jan 1, 2014
At the date of observation
Value
Absolute change
Change from previous value
jan 1, 1982
37.517 mln
+37.517 mln
0.0%
jan 1, 1983
32.396 mln
-5.121 mln
-13.65%
jan 1, 1984
41.357 mln
+8.961 mln
27.66%
jan 1, 1985
36.279 mln
-5.078 mln
-12.28%
jan 1, 1986
49.068 mln
+12.788 mln
35.25%
jan 1, 1987
56.334 mln
+7.266 mln
14.81%
jan 1, 1988
70.071 mln
+13.737 mln
24.39%
jan 1, 1989
105.07 mln
+34.998 mln
49.95%
jan 1, 1990
122.559 mln
+17.49 mln
16.65%
jan 1, 1991
234.648 mln
+112.089 mln
91.46%
jan 1, 1992
344.309 mln
+109.661 mln
46.73%
jan 1, 1993
445.988 mln
+101.68 mln
29.53%
jan 1, 1994
519.228 mln
+73.239 mln
16.42%
jan 1, 1995
607.185 mln
+87.957 mln
16.94%
jan 1, 1996
734.311 mln
+127.126 mln
20.94%
jan 1, 1997
877.13 mln
+142.819 mln
19.45%
jan 1, 1998
1.163 bln
+285.862 mln
32.59%
jan 1, 1999
1.532 bln
+369.47 mln
31.77%
jan 1, 2000
1.649 bln
+116.167 mln
7.58%
jan 1, 2001
2.324 bln
+675.741 mln
40.99%
jan 1, 2002
2.533 bln
+208.689 mln
8.98%
jan 1, 2003
2.578 bln
+44.574 mln
1.76%
jan 1, 2004
3.005 bln
+427.699 mln
16.59%
jan 1, 2005
3.184 bln
+178.838 mln
5.95%
jan 1, 2006
2.873 bln
-311.556 mln
-9.78%
jan 1, 2007
3.359 bln
+486.408 mln
16.93%
jan 1, 2008
3.835 bln
+476.149 mln
14.18%
jan 1, 2009
4.13 bln
+294.686 mln
7.68%
jan 1, 2010
3.601 bln
-529.102 mln
-12.81%
jan 1, 2011
2.814 bln
-786.961 mln
-21.86%
jan 1, 2012
3.347 bln
+533.338 mln
18.95%
jan 1, 2013
3.932 bln
+585.008 mln
17.48%
jan 1, 2014
4.426 bln
+493.637 mln
12.55%
jan 1, 2015
4.326 bln
-100.146 mln
-2.26%
jan 1, 2016
4.126 bln
-199.2 mln
-4.61%
Ranking of countries by current statistics by years


Comments: