29
/
en
AIzaSyAYiBZKx7MnpbEhh9jyipgxe19OcubqV5w
April 1, 2024
241105
Sint Maarten (Dutch part)
SXM
true
2
1
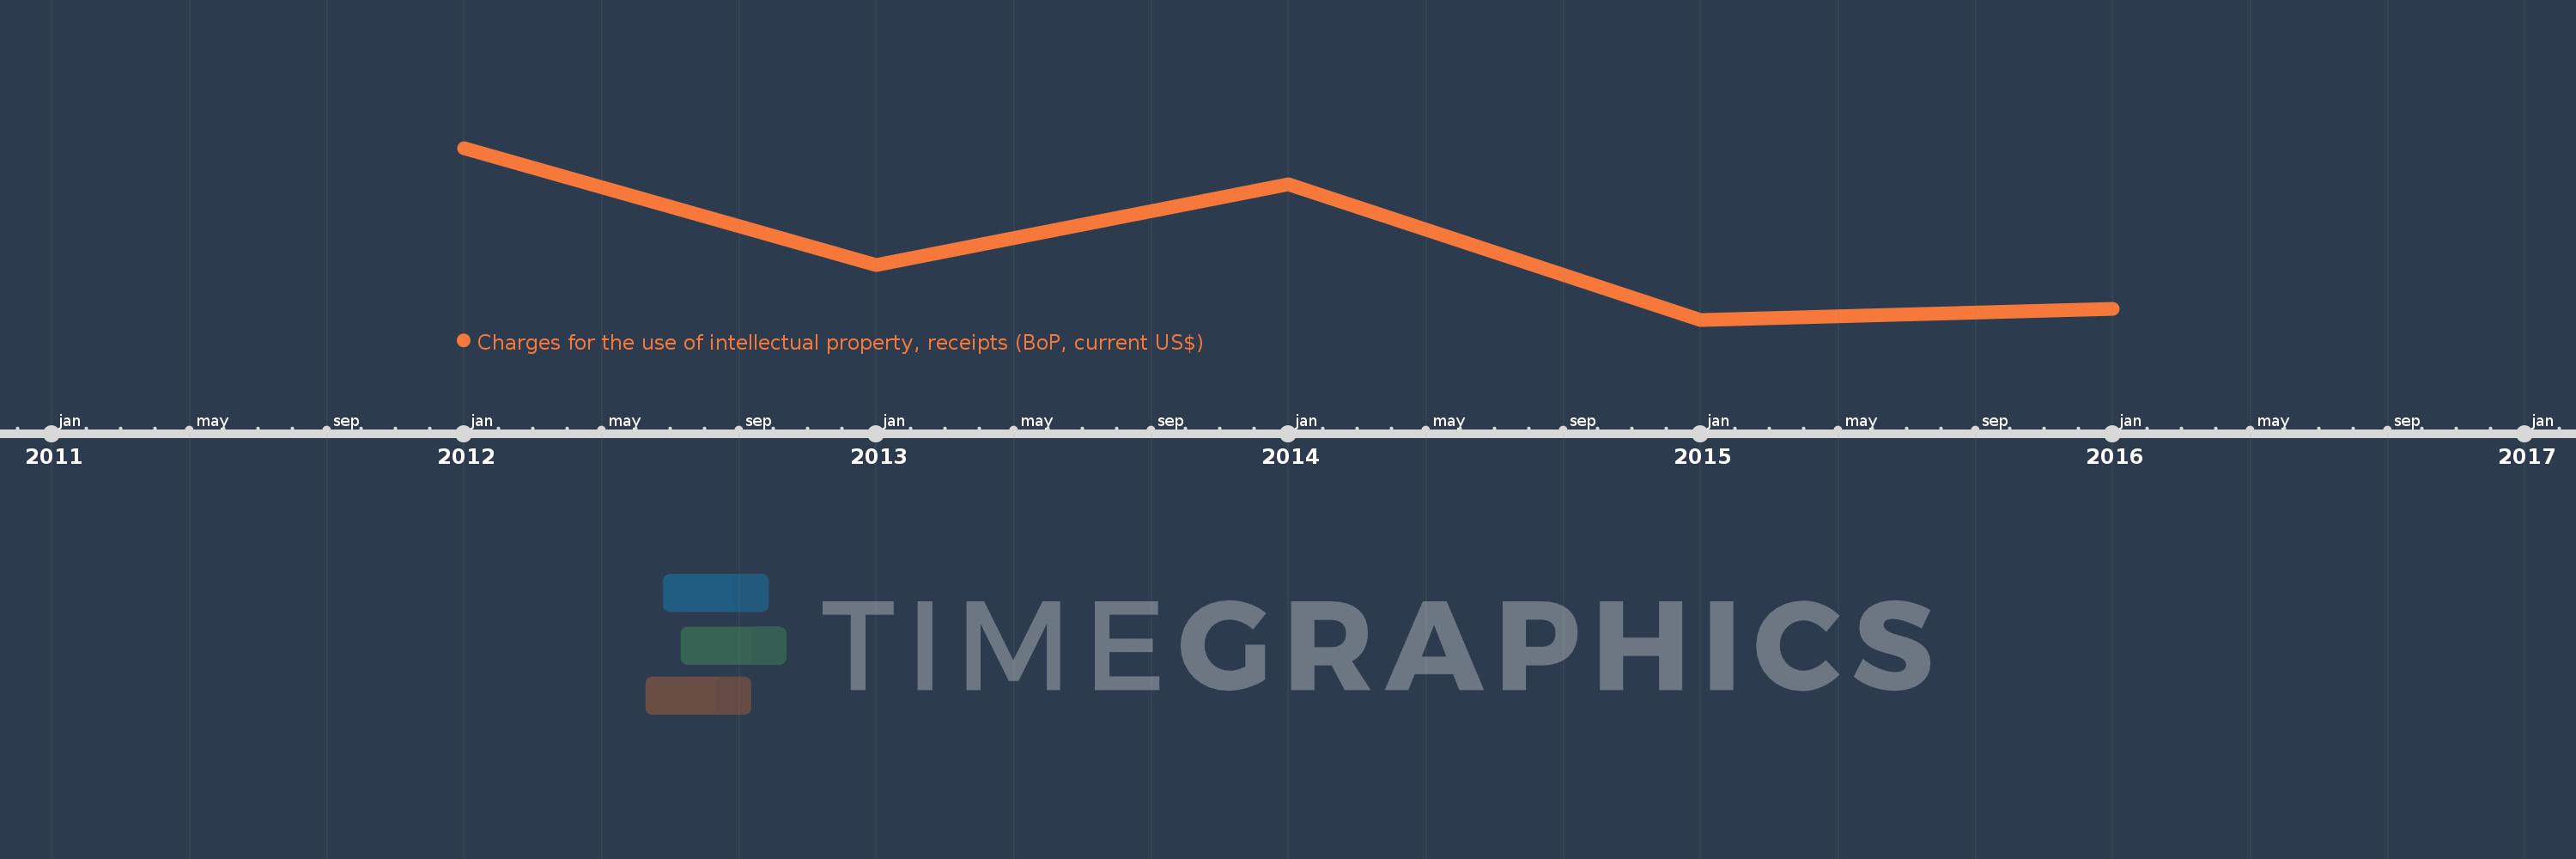
Charges for the use of intellectual property, receipts (BoP, current US$)
2016,2015,2014,2013,2012
This statistics in other country:
Timeline:
This timeline shows a graph from 2012 to 2016 of Sint Maarten (Dutch part). No data until 2011. Number of actual observations by date: 5.
Source name:
World Development Indicators
Source organization:
International Monetary Fund, Balance of Payments Statistics Yearbook and data files.
Categories, topics:
Economy & Growth, Science & Technology
Last updated:
apr 23, 2017
Indicators value changes by year
Minimum:
134.078K
jan 1, 2015
Maximum:
1.229 mln
jan 1, 2012
At the date of observation
Value
Absolute change
Change from previous value
jan 1, 2012
1.229 mln
+1.229 mln
0.0%
jan 1, 2013
480.447K
-748.603K
-60.91%
jan 1, 2014
1000.0K
+519.553K
108.14%
jan 1, 2015
134.078K
-865.922K
-86.59%
jan 1, 2016
201.117K
+67.039K
50.0%
Ranking of countries by current statistics by years


Comments: