29
/
en
AIzaSyAYiBZKx7MnpbEhh9jyipgxe19OcubqV5w
April 1, 2024
50698
Middle income
MIC
false
2
1
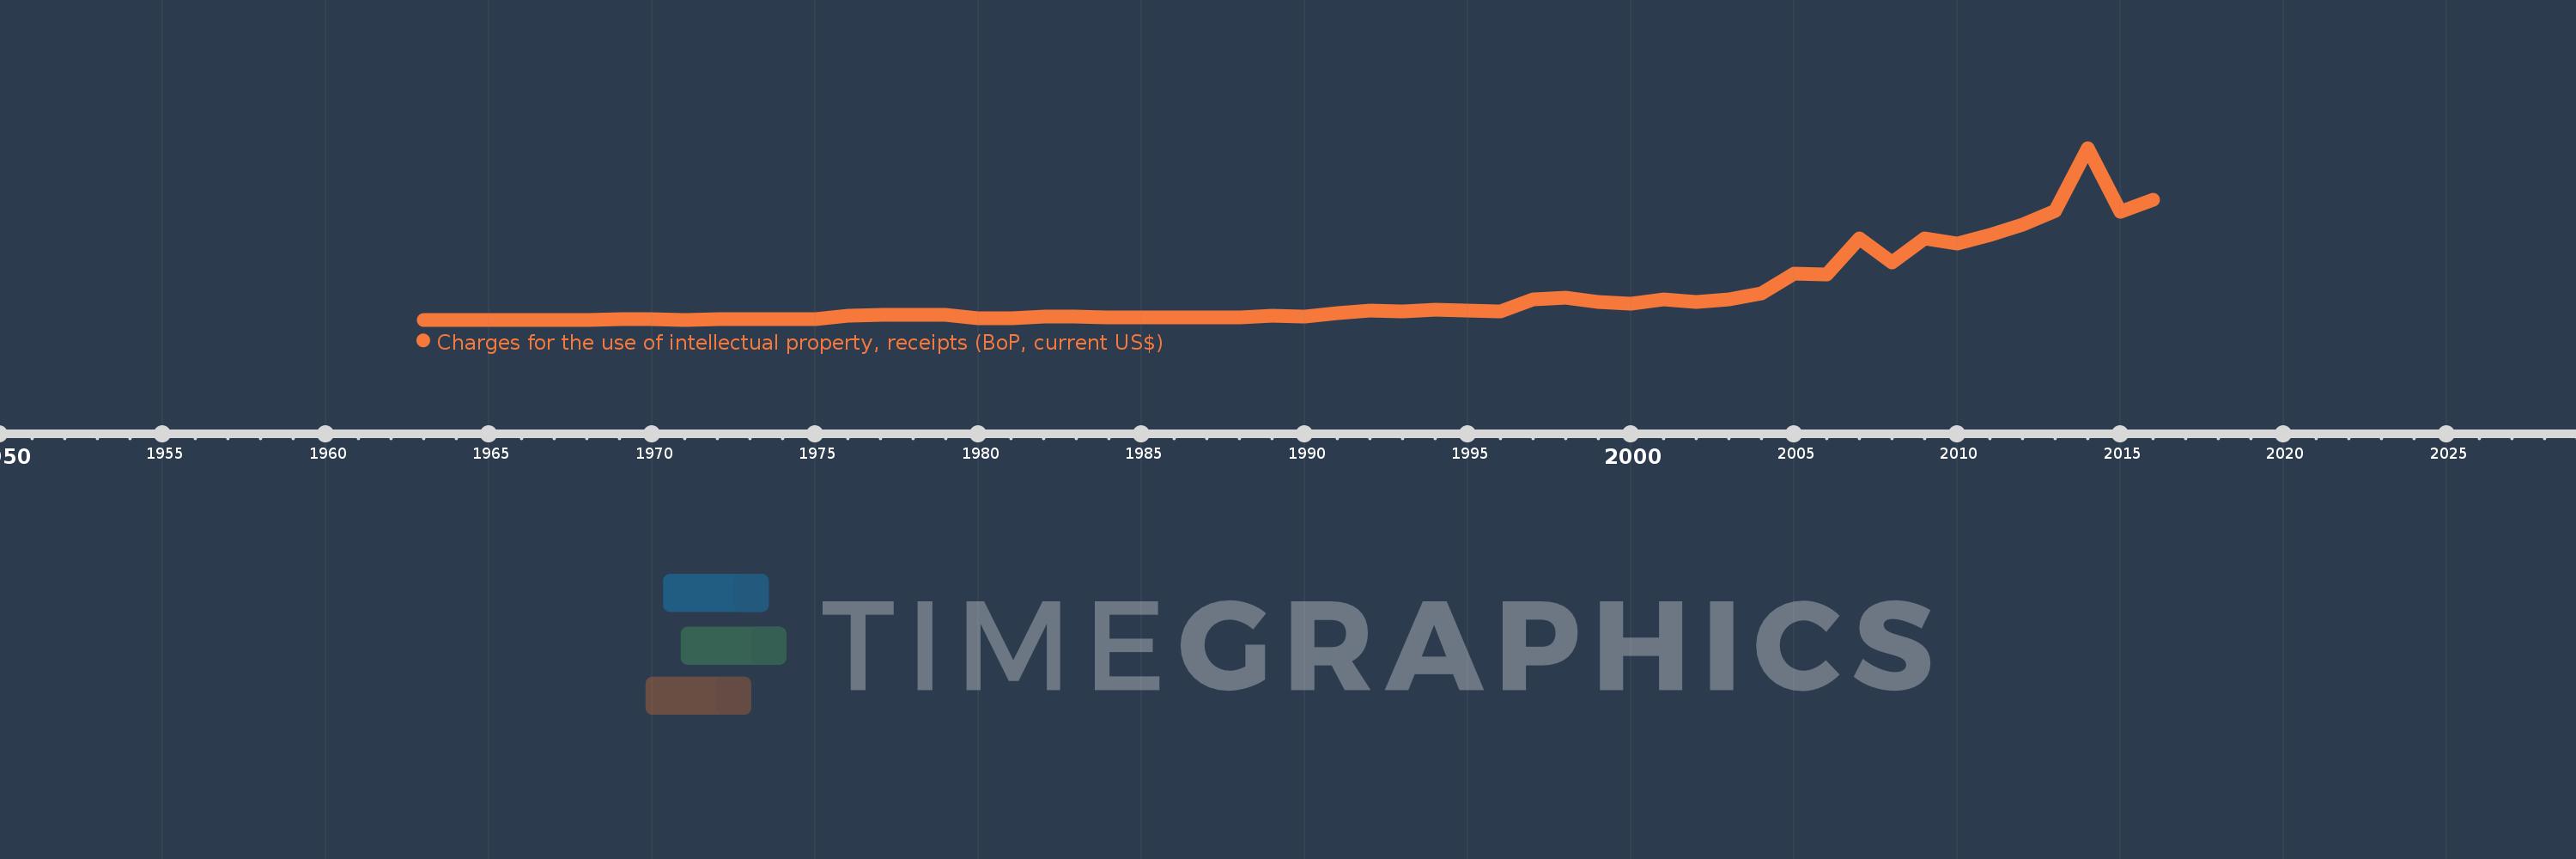
Charges for the use of intellectual property, receipts (BoP, current US$)
2016,2015,2014,2013,2012,2011,2010,2009,2008,2007,2006,2005,2004,2003,2002,2001,2000,1999,1998,1997,1996,1995,1994,1993,1992,1991,1990,1989,1988,1987,1986,1985,1984,1983,1982,1981,1980,1979,1978,1977,1976,1975,1974,1973,1972,1971,1970,1969,1968,1967,1966,1965,1964,1963
This statistics in other country:
Timeline:
This timeline shows a graph from 1963 to 2016 of Middle income. No data until 1962. Number of actual observations by date: 54.
Source name:
World Development Indicators
Source organization:
International Monetary Fund, Balance of Payments Statistics Yearbook and data files.
Categories, topics:
Economy & Growth, Science & Technology
Last updated:
apr 23, 2017
Indicators value changes by year
Minimum:
1.4 mln
jan 1, 1964
Maximum:
6.139 bln
jan 1, 2014
At the date of observation
Value
Absolute change
Change from previous value
jan 1, 1963
2.8 mln
+2.8 mln
0.0%
jan 1, 1964
1.4 mln
-1.4 mln
-50.0%
jan 1, 1965
2.8 mln
+1.4 mln
100.0%
jan 1, 1966
2.8 mln
0.0
0.0%
jan 1, 1967
2.8 mln
0.0
0.0%
jan 1, 1968
4.2 mln
+1.4 mln
50.0%
jan 1, 1969
13.6 mln
+9.4 mln
223.81%
jan 1, 1970
10.8 mln
-2.8 mln
-20.59%
jan 1, 1971
7.2 mln
-3.6 mln
-33.33%
jan 1, 1972
9.994 mln
+2.794 mln
38.81%
jan 1, 1973
12.424 mln
+2.429 mln
24.31%
jan 1, 1974
8.157 mln
-4.266 mln
-34.34%
jan 1, 1975
9.783 mln
+1.626 mln
19.93%
jan 1, 1976
152.539 mln
+142.756 mln
1.46K%
jan 1, 1977
177.502 mln
+24.963 mln
16.37%
jan 1, 1978
166.913 mln
-10.589 mln
-5.97%
jan 1, 1979
182.88 mln
+15.967 mln
9.57%
jan 1, 1980
43.494 mln
-139.386 mln
-76.22%
jan 1, 1981
68.417 mln
+24.923 mln
57.3%
jan 1, 1982
117.376 mln
+48.959 mln
71.56%
jan 1, 1983
105.403 mln
-11.974 mln
-10.2%
jan 1, 1984
86.441 mln
-18.962 mln
-17.99%
jan 1, 1985
84.921 mln
-1.52 mln
-1.76%
jan 1, 1986
77.933 mln
-6.988 mln
-8.23%
jan 1, 1987
73.26 mln
-4.672 mln
-6.0%
jan 1, 1988
83.46 mln
+10.199 mln
13.92%
jan 1, 1989
144.716 mln
+61.256 mln
73.4%
jan 1, 1990
104.6 mln
-40.116 mln
-27.72%
jan 1, 1991
237.417 mln
+132.818 mln
126.98%
jan 1, 1992
328.77 mln
+91.353 mln
38.48%
jan 1, 1993
313.686 mln
-15.084 mln
-4.59%
jan 1, 1994
370.761 mln
+57.075 mln
18.19%
jan 1, 1995
318.292 mln
-52.469 mln
-14.15%
jan 1, 1996
303.94 mln
-14.352 mln
-4.51%
jan 1, 1997
722.729 mln
+418.789 mln
137.79%
jan 1, 1998
781.792 mln
+59.063 mln
8.17%
jan 1, 1999
644.423 mln
-137.368 mln
-17.57%
jan 1, 2000
574.457 mln
-69.967 mln
-10.86%
jan 1, 2001
732.121 mln
+157.665 mln
27.45%
jan 1, 2002
629.374 mln
-102.747 mln
-14.03%
jan 1, 2003
737.437 mln
+108.063 mln
17.17%
jan 1, 2004
935.806 mln
+198.369 mln
26.9%
jan 1, 2005
1.659 bln
+723.344 mln
77.3%
jan 1, 2006
1.63 bln
-29.646 mln
-1.79%
jan 1, 2007
2.907 bln
+1.278 bln
78.41%
jan 1, 2008
2.061 bln
-846.293 mln
-29.11%
jan 1, 2009
2.907 bln
+845.802 mln
41.04%
jan 1, 2010
2.727 bln
-180.183 mln
-6.2%
jan 1, 2011
3.034 bln
+307.277 mln
11.27%
jan 1, 2012
3.387 bln
+352.798 mln
11.63%
jan 1, 2013
3.896 bln
+508.957 mln
15.03%
jan 1, 2014
6.139 bln
+2.244 bln
57.59%
jan 1, 2015
3.851 bln
-2.288 bln
-37.28%
jan 1, 2016
4.29 bln
+438.887 mln
11.4%
Ranking of countries by current statistics by years


Comments: