29
/
en
AIzaSyAYiBZKx7MnpbEhh9jyipgxe19OcubqV5w
April 1, 2024
175098
Latvia
LVA
true
2
1
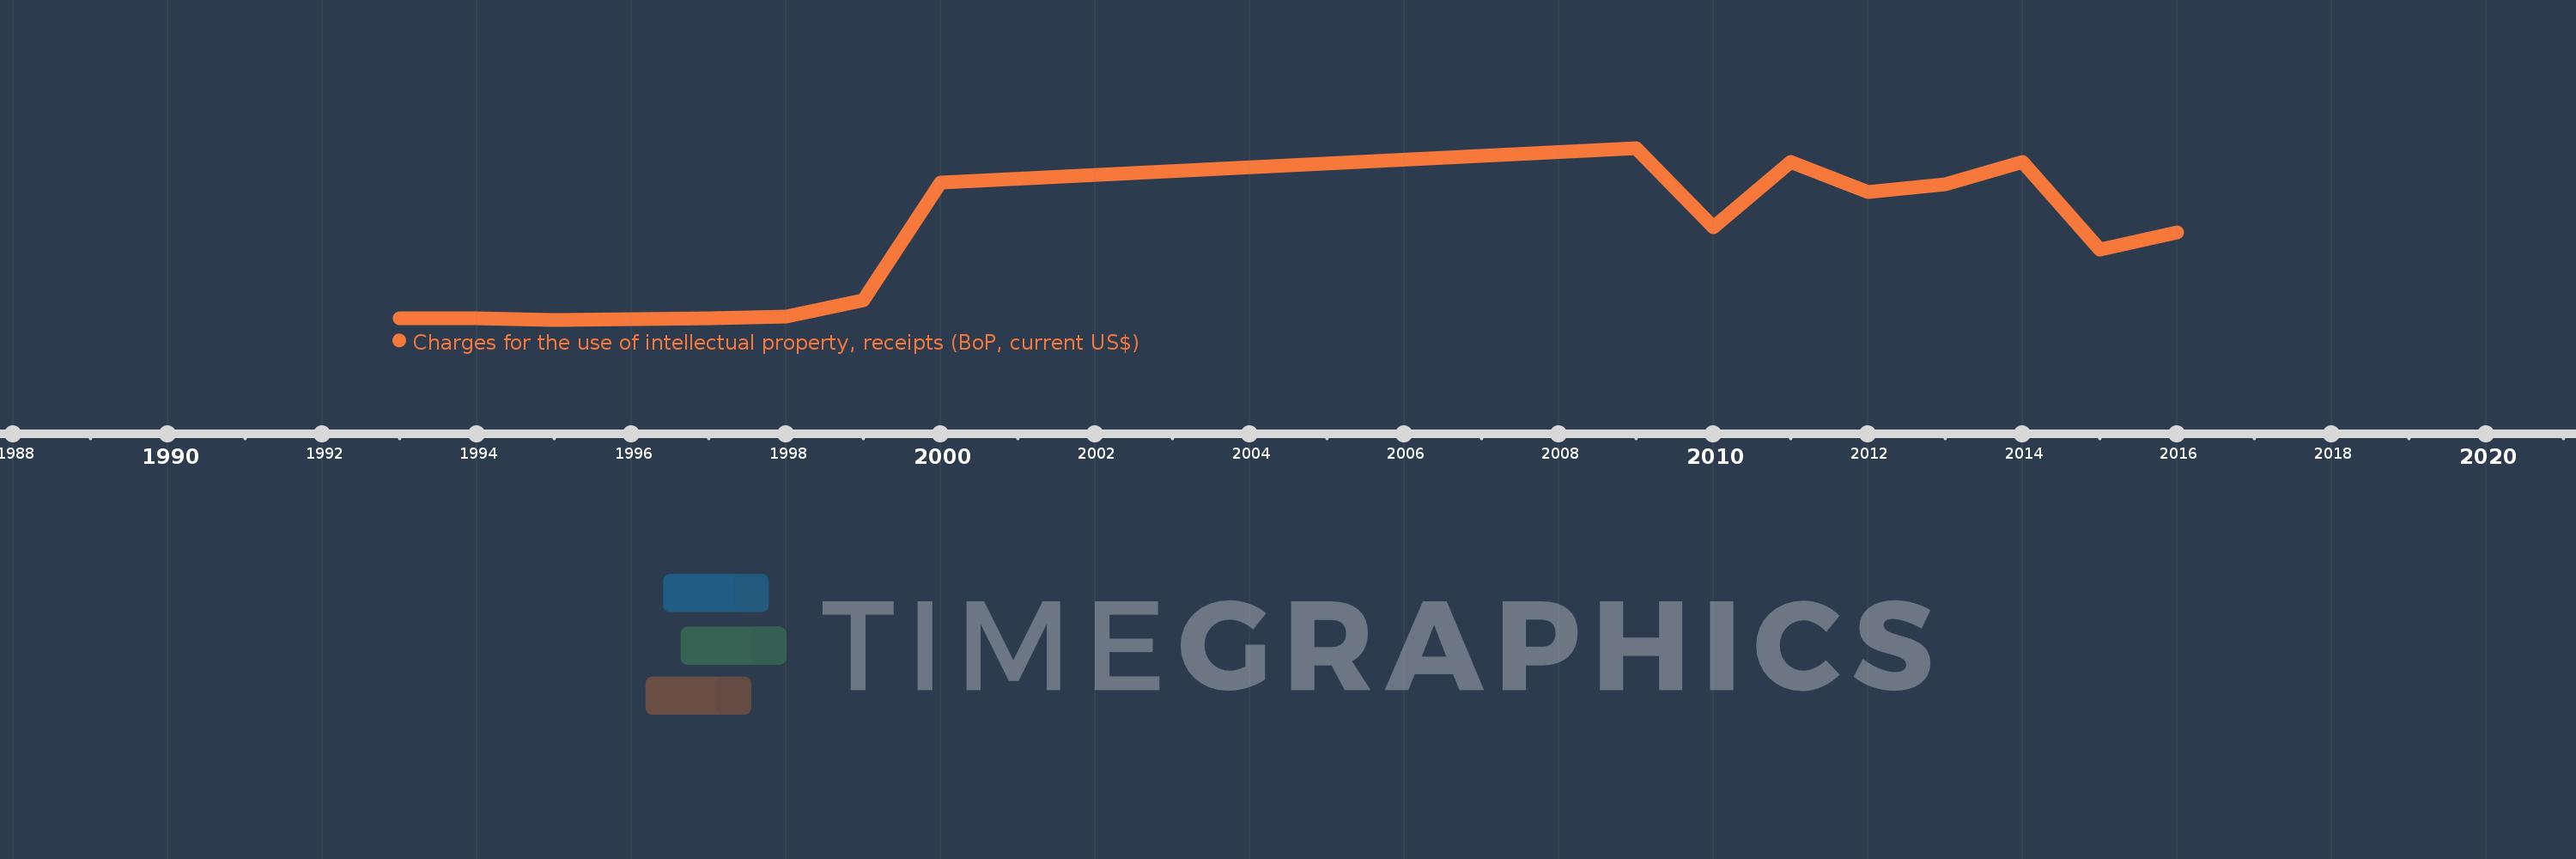
Charges for the use of intellectual property, receipts (BoP, current US$)
2016,2015,2014,2013,2012,2011,2010,2009,2000,1999,1998,1997,1995,1994,1993
This statistics in other country:
Timeline:
This timeline shows a graph from 1993 to 2016 of Latvia. No data until 1992. Number of actual observations by date: 15.
Source name:
World Development Indicators
Source organization:
International Monetary Fund, Balance of Payments Statistics Yearbook and data files.
Categories, topics:
Economy & Growth, Science & Technology
Last updated:
apr 23, 2017
Indicators value changes by year
Maximum:
13.023 mln
jan 1, 2009
At the date of observation
Value
Absolute change
Change from previous value
jan 1, 1993
149.355K
+149.355K
0.0%
jan 1, 1994
133.0K
-16.355K
-10.95%
jan 1, 1995
12.0K
-121.0K
-90.98%
jan 1, 1997
97.0K
+85.0K
708.33%
jan 1, 1998
236.0K
+139.0K
143.3%
jan 1, 1999
1.5 mln
+1.264 mln
535.59%
jan 1, 2000
10.4 mln
+8.9 mln
593.33%
jan 1, 2009
13.023 mln
+2.623 mln
25.22%
jan 1, 2010
7.0 mln
-6.023 mln
-46.25%
jan 1, 2011
11.967 mln
+4.967 mln
70.96%
jan 1, 2012
9.718 mln
-2.249 mln
-18.8%
jan 1, 2013
10.282 mln
+564.407K
5.81%
jan 1, 2014
11.931 mln
+1.649 mln
16.04%
jan 1, 2015
5.315 mln
-6.616 mln
-55.46%
jan 1, 2016
6.657 mln
+1.343 mln
25.27%
Ranking of countries by current statistics by years


Comments: