29
/
en
AIzaSyAYiBZKx7MnpbEhh9jyipgxe19OcubqV5w
April 1, 2024
25535
Central Europe and the Baltics
CEB
false
2
1
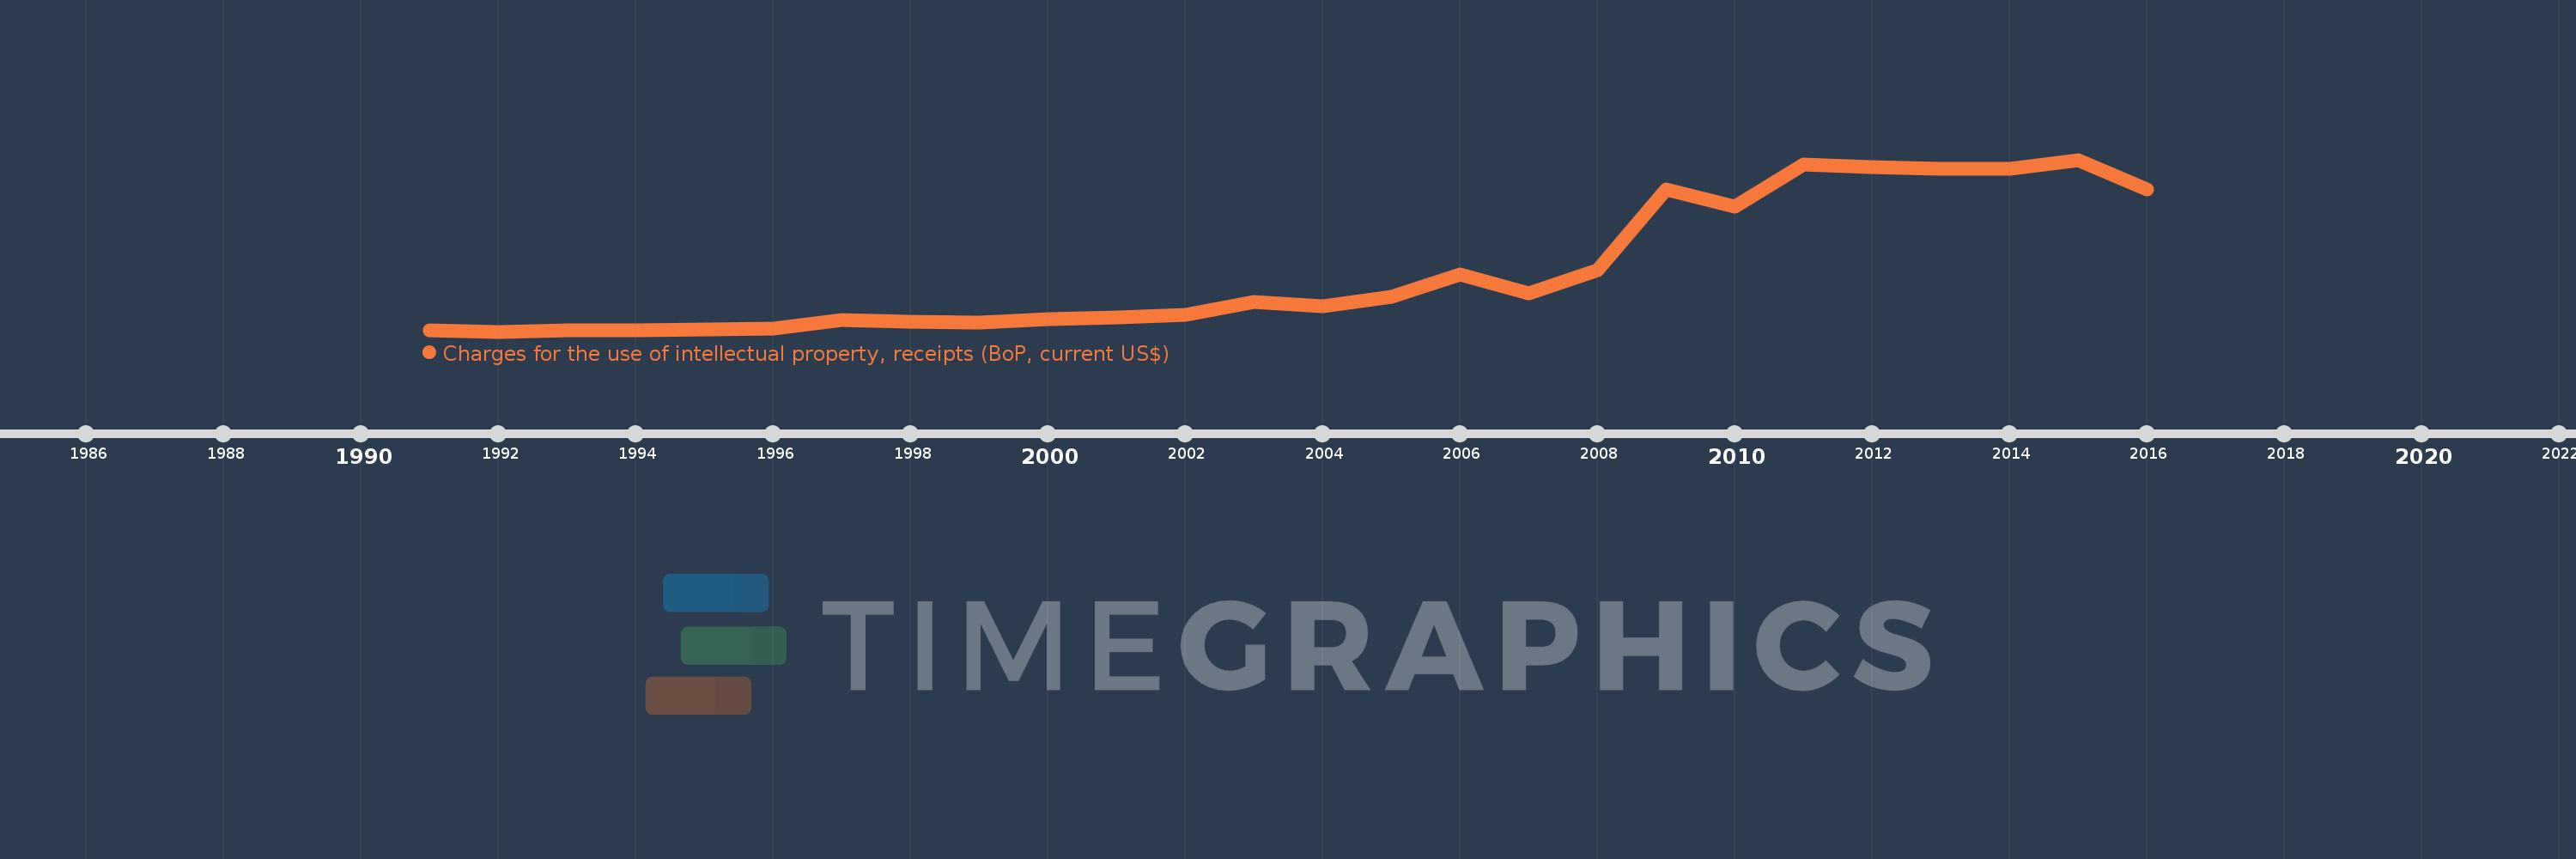
Charges for the use of intellectual property, receipts (BoP, current US$)
2016,2015,2014,2013,2012,2011,2010,2009,2008,2007,2006,2005,2004,2003,2002,2001,2000,1999,1998,1997,1996,1995,1994,1993,1992,1991
This statistics in other country:
Timeline:
This timeline shows a graph from 1991 to 2016 of Central Europe and the Baltics. No data until 1990. Number of actual observations by date: 26.
Source name:
World Development Indicators
Source organization:
International Monetary Fund, Balance of Payments Statistics Yearbook and data files.
Categories, topics:
Economy & Growth, Science & Technology
Last updated:
apr 23, 2017
Indicators value changes by year
Minimum:
18.058 mln
jan 1, 1992
Maximum:
3.261 bln
jan 1, 2015
At the date of observation
Value
Absolute change
Change from previous value
jan 1, 1991
48.528 mln
+48.528 mln
0.0%
jan 1, 1992
18.058 mln
-30.47 mln
-62.79%
jan 1, 1993
42.308 mln
+24.251 mln
134.3%
jan 1, 1994
40.065 mln
-2.243 mln
-5.3%
jan 1, 1995
51.802 mln
+11.737 mln
29.29%
jan 1, 1996
69.88 mln
+18.078 mln
34.9%
jan 1, 1997
241.113 mln
+171.233 mln
245.04%
jan 1, 1998
204.28 mln
-36.833 mln
-15.28%
jan 1, 1999
195.816 mln
-8.464 mln
-4.14%
jan 1, 2000
250.589 mln
+54.773 mln
27.97%
jan 1, 2001
292.285 mln
+41.697 mln
16.64%
jan 1, 2002
341.965 mln
+49.68 mln
17.0%
jan 1, 2003
572.006 mln
+230.041 mln
67.27%
jan 1, 2004
500.03 mln
-71.976 mln
-12.58%
jan 1, 2005
680.07 mln
+180.04 mln
36.01%
jan 1, 2006
1.089 bln
+408.436 mln
60.06%
jan 1, 2007
738.369 mln
-350.137 mln
-32.17%
jan 1, 2008
1.18 bln
+441.825 mln
59.84%
jan 1, 2009
2.7 bln
+1.52 bln
128.75%
jan 1, 2010
2.378 bln
-321.801 mln
-11.92%
jan 1, 2011
3.165 bln
+786.809 mln
33.09%
jan 1, 2012
3.116 bln
-48.742 mln
-1.54%
jan 1, 2013
3.094 bln
-21.604 mln
-0.69%
jan 1, 2014
3.084 bln
-9.948 mln
-0.32%
jan 1, 2015
3.261 bln
+176.953 mln
5.74%
jan 1, 2016
2.694 bln
-567.159 mln
-17.39%
Ranking of countries by current statistics by years


Comments: