29
/
en
AIzaSyAYiBZKx7MnpbEhh9jyipgxe19OcubqV5w
April 1, 2024
154298
India
IND
true
2
1
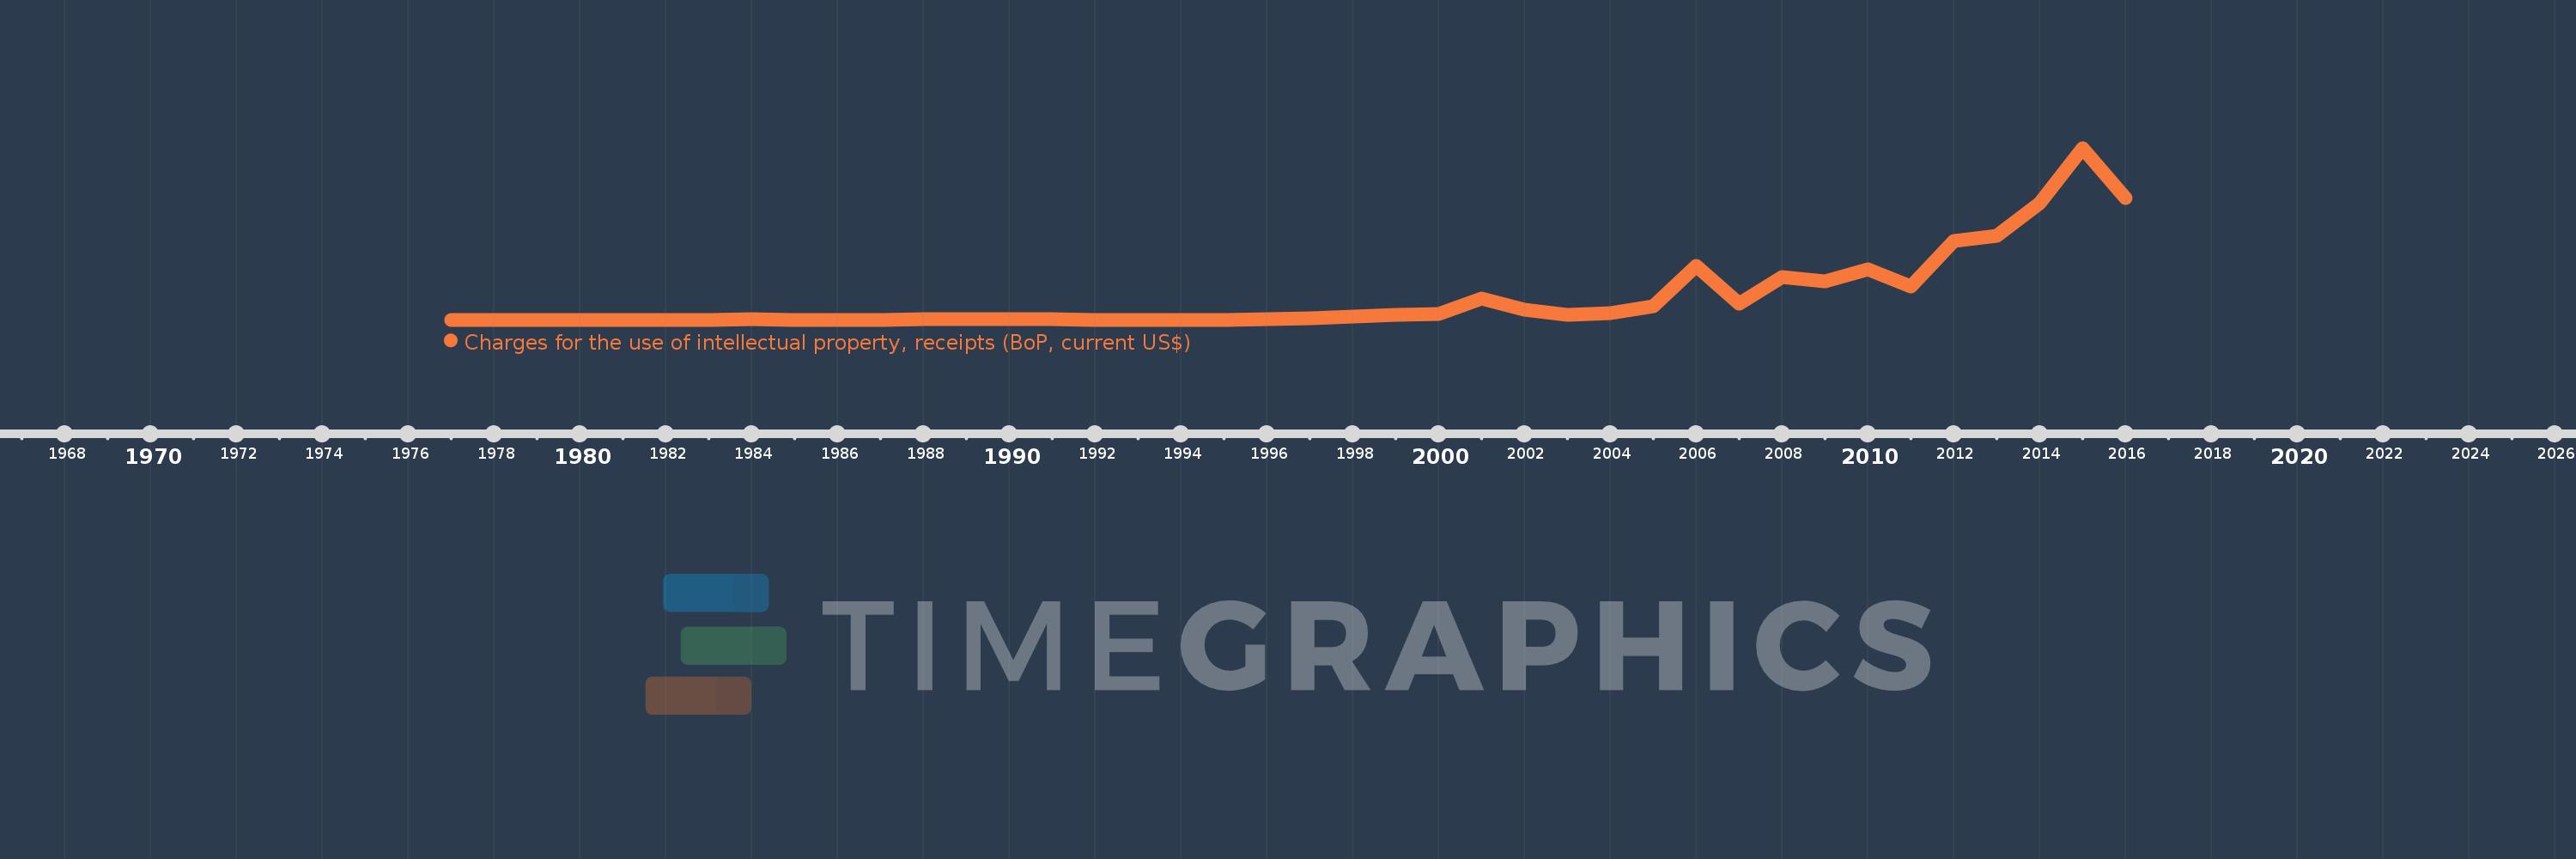
Charges for the use of intellectual property, receipts (BoP, current US$)
2016,2015,2014,2013,2012,2011,2010,2009,2008,2007,2006,2005,2004,2003,2002,2001,2000,1999,1998,1997,1996,1995,1994,1993,1992,1991,1990,1989,1988,1987,1986,1985,1984,1983,1982,1978,1977
This statistics in other country:
Timeline:
This timeline shows a graph from 1977 to 2016 of India. No data until 1976. Number of actual observations by date: 37.
Source name:
World Development Indicators
Source organization:
International Monetary Fund, Balance of Payments Statistics Yearbook and data files.
Categories, topics:
Economy & Growth, Science & Technology
Last updated:
apr 23, 2017
Indicators value changes by year
Minimum:
111.305K
jan 1, 1982
Maximum:
658.722 mln
jan 1, 2015
At the date of observation
Value
Absolute change
Change from previous value
jan 1, 1977
111.524K
+111.524K
0.0%
jan 1, 1978
113.46K
+1.936K
1.74%
jan 1, 1982
111.305K
-2.155K
-1.9%
jan 1, 1983
625.124K
+513.819K
461.63%
jan 1, 1984
896.69K
+271.566K
43.44%
jan 1, 1985
173.389K
-723.301K
-80.66%
jan 1, 1986
165.408K
-7.981K
-4.6%
jan 1, 1987
397.33K
+231.922K
140.21%
jan 1, 1988
771.836K
+374.506K
94.26%
jan 1, 1989
1.032 mln
+260.188K
33.71%
jan 1, 1990
1.292 mln
+260.388K
25.23%
jan 1, 1991
1.323 mln
+30.987K
2.4%
jan 1, 1992
615.525K
-707.874K
-53.49%
jan 1, 1993
731.659K
+116.134K
18.87%
jan 1, 1994
290.98K
-440.679K
-60.23%
jan 1, 1995
446.175K
+155.195K
53.34%
jan 1, 1996
1.396 mln
+949.375K
212.78%
jan 1, 1997
6.899 mln
+5.504 mln
394.38%
jan 1, 1998
12.414 mln
+5.515 mln
79.93%
jan 1, 1999
19.304 mln
+6.89 mln
55.5%
jan 1, 2000
22.884 mln
+3.58 mln
18.55%
jan 1, 2001
82.549 mln
+59.665 mln
260.73%
jan 1, 2002
37.156 mln
-45.393 mln
-54.99%
jan 1, 2003
20.16 mln
-16.996 mln
-45.74%
jan 1, 2004
24.089 mln
+3.929 mln
19.49%
jan 1, 2005
52.796 mln
+28.707 mln
119.17%
jan 1, 2006
205.975 mln
+153.179 mln
290.13%
jan 1, 2007
60.913 mln
-145.061 mln
-70.43%
jan 1, 2008
163.126 mln
+102.213 mln
167.8%
jan 1, 2009
147.815 mln
-15.311 mln
-9.39%
jan 1, 2010
191.94 mln
+44.124 mln
29.85%
jan 1, 2011
127.378 mln
-64.561 mln
-33.64%
jan 1, 2012
302.616 mln
+175.238 mln
137.57%
jan 1, 2013
321.445 mln
+18.829 mln
6.22%
jan 1, 2014
445.568 mln
+124.123 mln
38.61%
jan 1, 2015
658.722 mln
+213.154 mln
47.84%
jan 1, 2016
466.557 mln
-192.166 mln
-29.17%
Ranking of countries by current statistics by years


Comments: