29
/
en
AIzaSyAYiBZKx7MnpbEhh9jyipgxe19OcubqV5w
April 1, 2024
60596
Sub-Saharan Africa (IDA & IBRD countries)
TSS
false
2
1
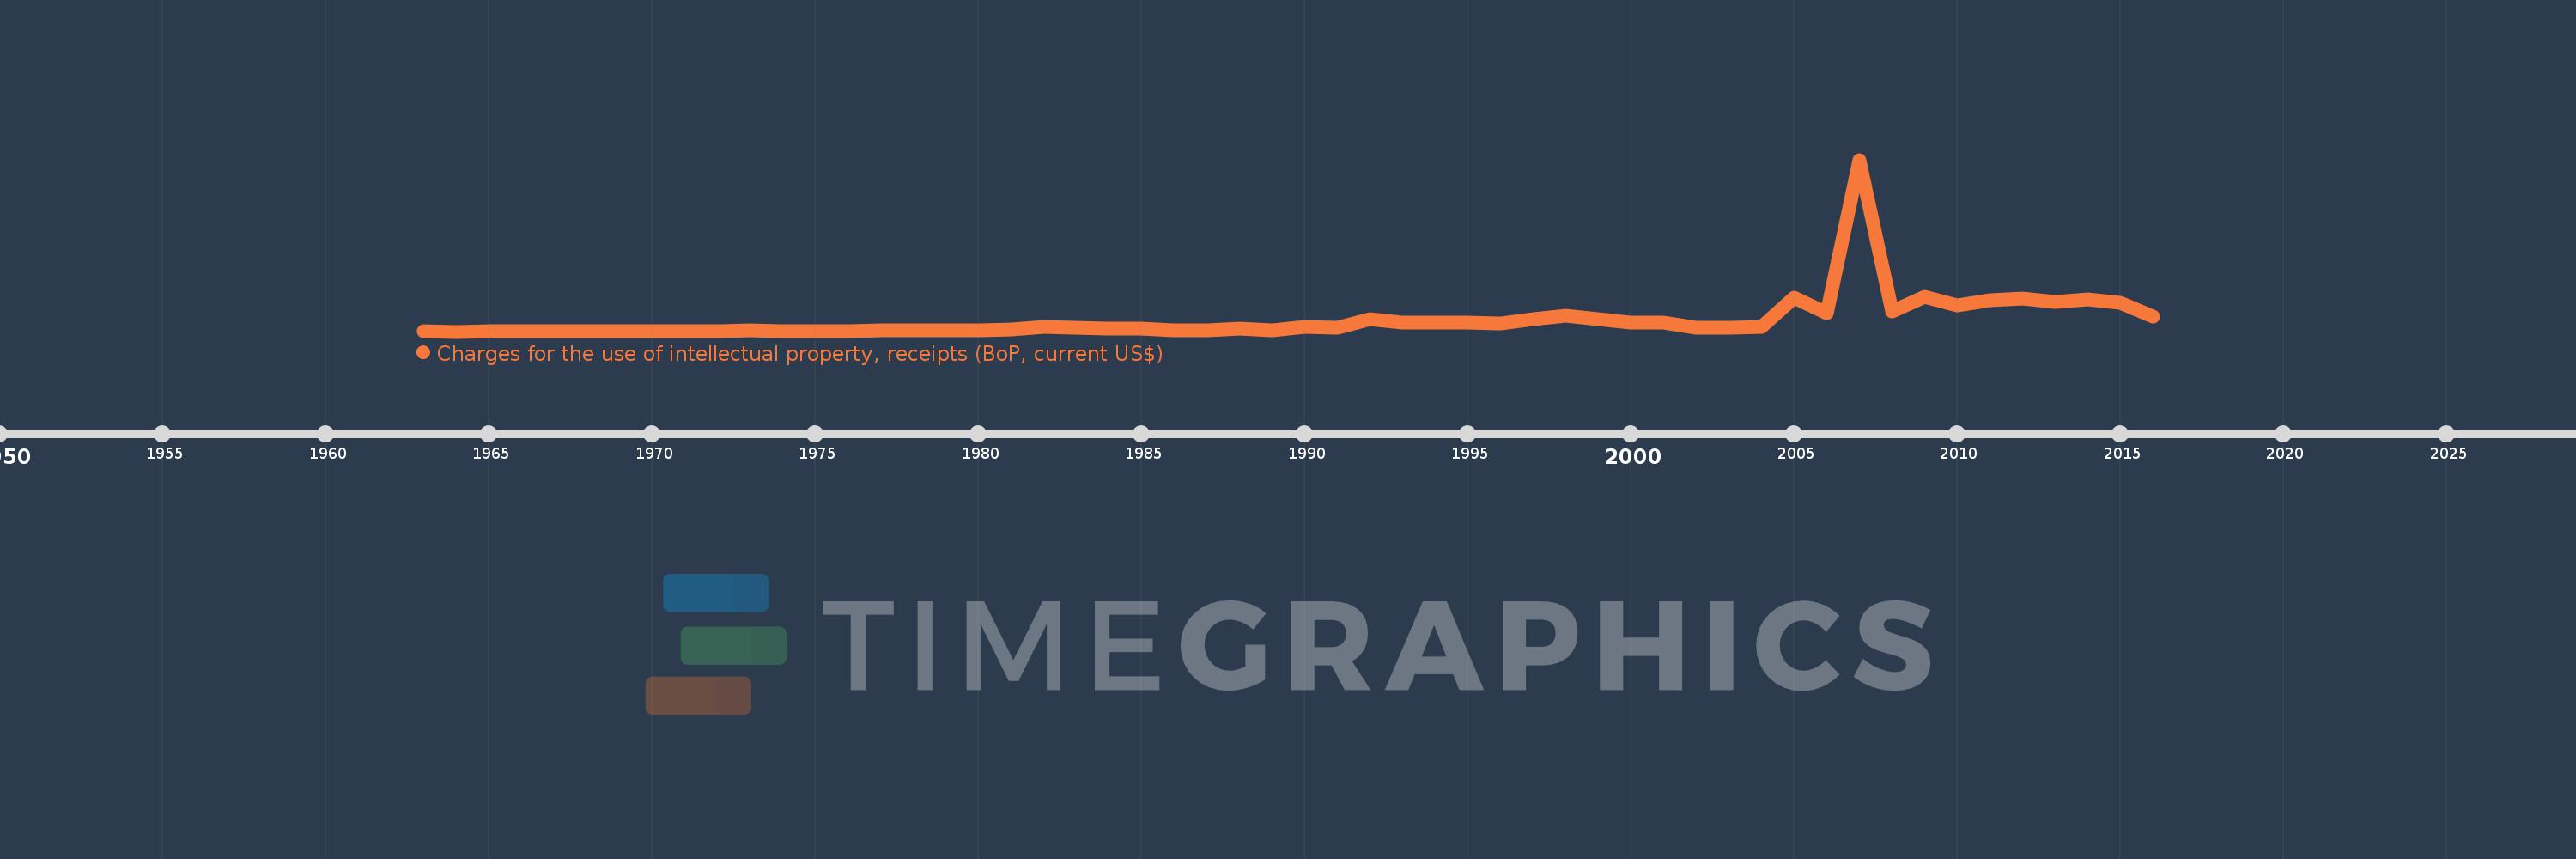
Charges for the use of intellectual property, receipts (BoP, current US$)
2016,2015,2014,2013,2012,2011,2010,2009,2008,2007,2006,2005,2004,2003,2002,2001,2000,1999,1998,1997,1996,1995,1994,1993,1992,1991,1990,1989,1988,1987,1986,1985,1984,1983,1982,1981,1980,1979,1978,1977,1976,1975,1974,1973,1972,1971,1970,1969,1968,1967,1966,1965,1964,1963
This statistics in other country:
Timeline:
This timeline shows a graph from 1963 to 2016 of Sub-Saharan Africa (IDA & IBRD countries). No data until 1962. Number of actual observations by date: 54.
Source name:
World Development Indicators
Source organization:
International Monetary Fund, Balance of Payments Statistics Yearbook and data files.
Categories, topics:
Economy & Growth, Science & Technology
Last updated:
apr 23, 2017
Indicators value changes by year
Minimum:
1.4 mln
jan 1, 1964
Maximum:
1.46 bln
jan 1, 2007
At the date of observation
Value
Absolute change
Change from previous value
jan 1, 1963
2.8 mln
+2.8 mln
0.0%
jan 1, 1964
1.4 mln
-1.4 mln
-50.0%
jan 1, 1965
2.8 mln
+1.4 mln
100.0%
jan 1, 1966
2.8 mln
0.0
0.0%
jan 1, 1967
2.8 mln
0.0
0.0%
jan 1, 1968
4.2 mln
+1.4 mln
50.0%
jan 1, 1969
5.6 mln
+1.4 mln
33.33%
jan 1, 1970
2.8 mln
-2.8 mln
-50.0%
jan 1, 1971
4.2 mln
+1.4 mln
50.0%
jan 1, 1972
6.985 mln
+2.785 mln
66.32%
jan 1, 1973
10.252 mln
+3.267 mln
46.76%
jan 1, 1974
5.773 mln
-4.479 mln
-43.69%
jan 1, 1975
7.42 mln
+1.646 mln
28.52%
jan 1, 1976
8.352 mln
+932.218K
12.56%
jan 1, 1977
10.392 mln
+2.04 mln
24.43%
jan 1, 1978
11.186 mln
+793.686K
7.64%
jan 1, 1979
11.023 mln
-162.979K
-1.46%
jan 1, 1980
13.015 mln
+1.992 mln
18.07%
jan 1, 1981
19.573 mln
+6.558 mln
50.39%
jan 1, 1982
42.522 mln
+22.949 mln
117.25%
jan 1, 1983
31.308 mln
-11.214 mln
-26.37%
jan 1, 1984
27.045 mln
-4.264 mln
-13.62%
jan 1, 1985
23.39 mln
-3.655 mln
-13.51%
jan 1, 1986
12.28 mln
-11.11 mln
-47.5%
jan 1, 1987
15.26 mln
+2.98 mln
24.27%
jan 1, 1988
24.427 mln
+9.167 mln
60.07%
jan 1, 1989
15.927 mln
-8.501 mln
-34.8%
jan 1, 1990
43.561 mln
+27.634 mln
173.51%
jan 1, 1991
32.361 mln
-11.2 mln
-25.71%
jan 1, 1992
105.754 mln
+73.393 mln
226.79%
jan 1, 1993
77.173 mln
-28.581 mln
-27.03%
jan 1, 1994
77.911 mln
+737.647K
0.96%
jan 1, 1995
80.493 mln
+2.582 mln
3.31%
jan 1, 1996
69.877 mln
-10.616 mln
-13.19%
jan 1, 1997
107.957 mln
+38.08 mln
54.5%
jan 1, 1998
136.694 mln
+28.737 mln
26.62%
jan 1, 1999
110.489 mln
-26.206 mln
-19.17%
jan 1, 2000
80.575 mln
-29.913 mln
-27.07%
jan 1, 2001
81.274 mln
+698.883K
0.87%
jan 1, 2002
37.33 mln
-43.944 mln
-54.07%
jan 1, 2003
35.123 mln
-2.207 mln
-5.91%
jan 1, 2004
44.617 mln
+9.494 mln
27.03%
jan 1, 2005
288.331 mln
+243.713 mln
546.23%
jan 1, 2006
161.491 mln
-126.84 mln
-43.99%
jan 1, 2007
1.46 bln
+1.299 bln
804.38%
jan 1, 2008
169.488 mln
-1.291 bln
-88.4%
jan 1, 2009
298.983 mln
+129.495 mln
76.4%
jan 1, 2010
227.395 mln
-71.588 mln
-23.94%
jan 1, 2011
271.212 mln
+43.817 mln
19.27%
jan 1, 2012
279.93 mln
+8.718 mln
3.21%
jan 1, 2013
253.062 mln
-26.868 mln
-9.6%
jan 1, 2014
272.095 mln
+19.032 mln
7.52%
jan 1, 2015
243.023 mln
-29.071 mln
-10.68%
jan 1, 2016
130.14 mln
-112.883 mln
-46.45%
Ranking of countries by current statistics by years


Comments: