29
/
en
AIzaSyAYiBZKx7MnpbEhh9jyipgxe19OcubqV5w
April 1, 2024
271344
Tuvalu
TUV
true
2
1
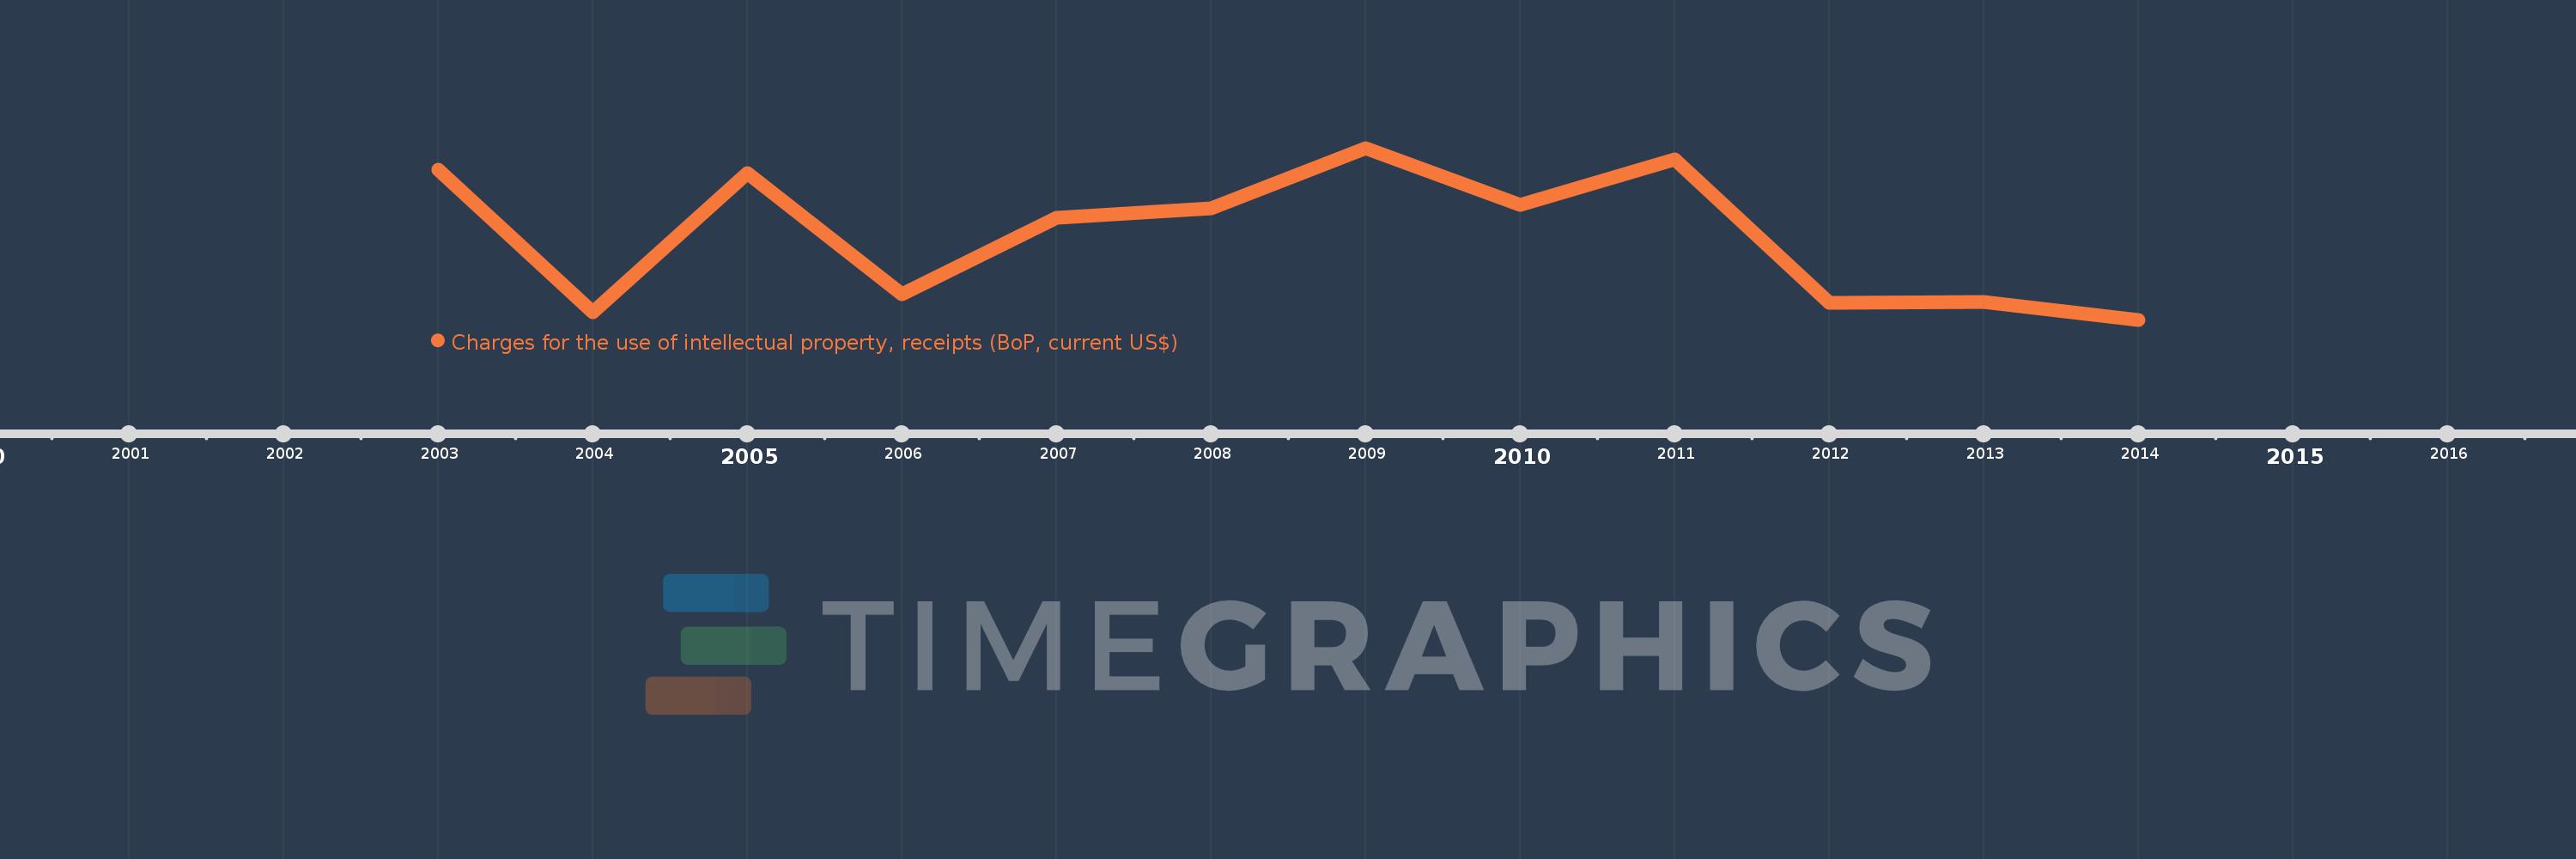
Charges for the use of intellectual property, receipts (BoP, current US$)
2014,2013,2012,2011,2010,2009,2008,2007,2006,2005,2004,2003
This statistics in other country:
Timeline:
This timeline shows a graph from 2003 to 2014 of Tuvalu. No data until 2002. Number of actual observations by date: 12.
Source name:
World Development Indicators
Source organization:
International Monetary Fund, Balance of Payments Statistics Yearbook and data files.
Categories, topics:
Economy & Growth, Science & Technology
Last updated:
apr 23, 2017
Indicators value changes by year
Minimum:
13.826K
jan 1, 2014
Maximum:
23.486K
jan 1, 2009
At the date of observation
Value
Absolute change
Change from previous value
jan 1, 2003
22.276K
+22.276K
0.0%
jan 1, 2004
14.268K
-8.008K
-35.95%
jan 1, 2005
22.063K
+7.795K
54.63%
jan 1, 2006
15.273K
-6.79K
-30.77%
jan 1, 2007
19.579K
+4.305K
28.19%
jan 1, 2008
20.082K
+503.759
2.57%
jan 1, 2009
23.486K
+3.404K
16.95%
jan 1, 2010
20.278K
-3.209K
-13.66%
jan 1, 2011
22.839K
+2.561K
12.63%
jan 1, 2012
14.773K
-8.066K
-35.32%
jan 1, 2013
14.829K
+56.017
0.38%
jan 1, 2014
13.826K
-1.003K
-6.76%
Ranking of countries by current statistics by years


Comments: