29
/
en
AIzaSyAYiBZKx7MnpbEhh9jyipgxe19OcubqV5w
April 1, 2024
96394
Burundi
BDI
true
2
1
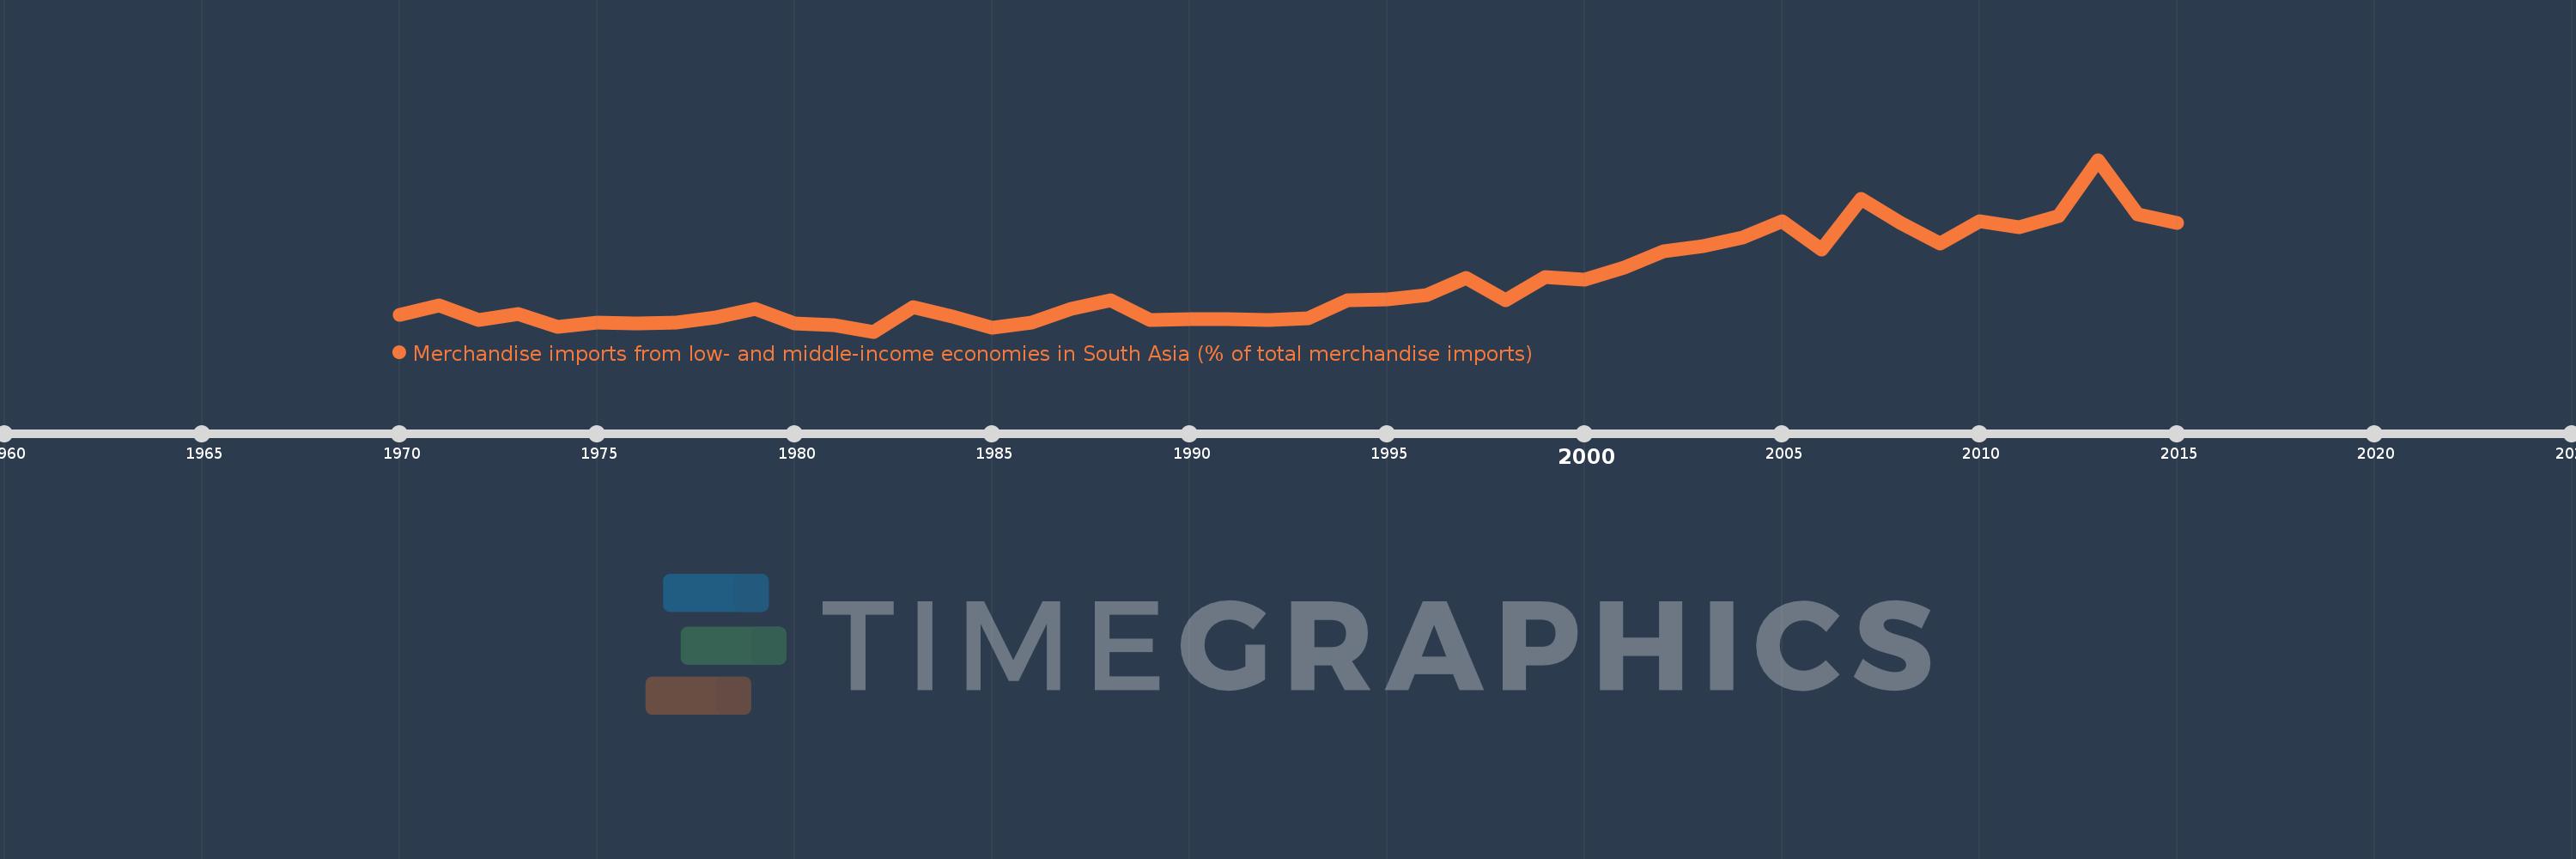
Merchandise imports from low- and middle-income economies in South Asia (% of total merchandise imports)
2015,2014,2013,2012,2011,2010,2009,2008,2007,2006,2005,2004,2003,2002,2001,2000,1999,1998,1997,1996,1995,1994,1993,1992,1991,1990,1989,1988,1987,1986,1985,1984,1983,1982,1981,1980,1979,1978,1977,1976,1975,1974,1973,1972,1971,1970
This statistics in other country:
AfghanistanAlbaniaAlgeriaAngolaAntigua and BarbudaArab WorldArgentinaArmeniaArubaAustraliaAustriaAzerbaijanBahamas, TheBahrainBangladeshBarbadosBelarusBelgiumBelizeBeninBermudaBoliviaBrazilBrunei DarussalamBulgariaBurkina FasoBurundiCabo VerdeCambodiaCameroonCanadaCaribbean small statesCentral African RepublicCentral Europe and the BalticsChadChileChinaColombiaCongo, Dem. Rep.Congo, Rep.Costa RicaCote d'IvoireCroatiaCubaCyprusCzech RepublicDenmarkDjiboutiDominicaDominican RepublicEarly-demographic dividendEast Asia & PacificEast Asia & Pacific (excluding high income)East Asia & Pacific (IDA & IBRD countries)EcuadorEgypt, Arab Rep.El SalvadorEstoniaEthiopiaEuro areaEurope & Central AsiaEurope & Central Asia (excluding high income)Europe & Central Asia (IDA & IBRD countries)European UnionFaroe IslandsFijiFinlandFragile and conflict affected situationsFranceGabonGambia, TheGeorgiaGermanyGhanaGibraltarGreeceGreenlandGrenadaGuatemalaGuineaGuyanaHaitiHeavily indebted poor countries (HIPC)High incomeHondurasHong Kong SAR, ChinaHungaryIBRD onlyIcelandIDA & IBRD totalIDA blendIDA onlyIDA totalIndiaIndonesiaIran, Islamic Rep.IraqIrelandIsraelItalyJamaicaJapanJordanKazakhstanKenyaKiribatiKorea, Dem. People’s Rep.Korea, Rep.KosovoKuwaitKyrgyz RepublicLao PDRLate-demographic dividendLatin America & Caribbean Latin America & Caribbean (excluding high income)Latin America & the Caribbean (IDA & IBRD countries)LatviaLeast developed countries: UN classificationLebanonLiberiaLibyaLithuaniaLow & middle incomeLow incomeLower middle incomeLuxembourgMacao SAR, ChinaMacedonia, FYRMadagascarMalawiMalaysiaMaldivesMaliMaltaMauritaniaMauritiusMexicoMiddle East & North AfricaMiddle East & North Africa (excluding high income)Middle East & North Africa (IDA & IBRD countries)Middle incomeMoldovaMongoliaMontenegroMoroccoMozambiqueMyanmarNauruNepalNetherlandsNew CaledoniaNew ZealandNicaraguaNigerNigeriaNorth AmericaNorwayOECD membersOmanOther small statesPacific island small statesPakistanPanamaPapua New GuineaParaguayPeruPhilippinesPolandPortugalPost-demographic dividendPre-demographic dividendQatarRomaniaRussian FederationRwandaSamoaSaudi ArabiaSenegalSerbiaSeychellesSierra LeoneSingaporeSlovak RepublicSloveniaSmall statesSolomon IslandsSomaliaSouth AfricaSouth AsiaSouth Asia (IDA & IBRD)SpainSri LankaSt. Kitts and NevisSt. LuciaSt. Vincent and the GrenadinesSub-Saharan Africa Sub-Saharan Africa (excluding high income)Sub-Saharan Africa (IDA & IBRD countries)SudanSurinameSwedenSwitzerlandSyrian Arab RepublicTajikistanTanzaniaThailandTogoTongaTrinidad and TobagoTunisiaTurkeyTurkmenistanUgandaUkraineUnited Arab EmiratesUnited KingdomUnited StatesUpper middle incomeUruguayUzbekistanVanuatuVenezuela, RBVietnamWorldYemen, Rep.ZambiaZimbabwe Timeline:
This timeline shows a graph from 1970 to 2015 of Burundi. No data until 1969. Number of actual observations by date: 46.
Source name:
World Development Indicators
Source organization:
World Bank staff estimates based data from International Monetary Fund's Direction of Trade database.
Categories, topics:
Private Sector, Trade
Last updated:
apr 23, 2017
Indicators value changes by year
At the date of observation
Value
Absolute change
Change from previous value
jan 1, 1970
0.922
+0.922
0.0%
jan 1, 1971
1.345
+0.424
45.96%
jan 1, 1972
0.669
-0.676
-50.28%
jan 1, 1973
0.958
+0.29
43.29%
jan 1, 1974
0.321
-0.638
-66.56%
jan 1, 1975
0.531
+0.211
65.7%
jan 1, 1976
0.488
-0.043
-8.08%
jan 1, 1977
0.54
+0.052
10.71%
jan 1, 1978
0.805
+0.264
48.87%
jan 1, 1979
1.207
+0.402
49.96%
jan 1, 1980
0.501
-0.705
-58.46%
jan 1, 1981
0.416
-0.085
-17.01%
jan 1, 1982
0.103
-0.312
-75.12%
jan 1, 1983
1.298
+1.195
1.15K%
jan 1, 1984
0.812
-0.486
-37.42%
jan 1, 1985
0.307
-0.506
-62.22%
jan 1, 1986
0.517
+0.21
68.46%
jan 1, 1987
1.179
+0.662
128.04%
jan 1, 1988
1.595
+0.416
35.26%
jan 1, 1989
0.675
-0.92
-57.67%
jan 1, 1990
0.696
+0.021
3.13%
jan 1, 1991
0.702
+0.005
0.77%
jan 1, 1992
0.681
-0.02
-2.87%
jan 1, 1993
0.73
+0.048
7.07%
jan 1, 1994
1.614
+0.884
121.21%
jan 1, 1995
1.657
+0.043
2.68%
jan 1, 1996
1.846
+0.188
11.36%
jan 1, 1997
2.673
+0.828
44.85%
jan 1, 1998
1.621
-1.053
-39.38%
jan 1, 1999
2.722
+1.101
67.94%
jan 1, 2000
2.59
-0.132
-4.84%
jan 1, 2001
3.196
+0.607
23.42%
jan 1, 2002
3.969
+0.772
24.16%
jan 1, 2003
4.231
+0.263
6.63%
jan 1, 2004
4.625
+0.394
9.31%
jan 1, 2005
5.421
+0.796
17.2%
jan 1, 2006
4.065
-1.356
-25.02%
jan 1, 2007
6.488
+2.424
59.63%
jan 1, 2008
5.343
-1.145
-17.65%
jan 1, 2009
4.356
-0.987
-18.48%
jan 1, 2010
5.394
+1.038
23.83%
jan 1, 2011
5.114
-0.28
-5.19%
jan 1, 2012
5.665
+0.551
10.78%
jan 1, 2013
8.37
+2.706
47.77%
jan 1, 2014
5.758
-2.612
-31.2%
jan 1, 2015
5.331
-0.427
-7.41%
Ranking of countries by current statistics by years


Comments: