29
/
en
AIzaSyAYiBZKx7MnpbEhh9jyipgxe19OcubqV5w
April 1, 2024
120118
Djibouti
DJI
true
2
1
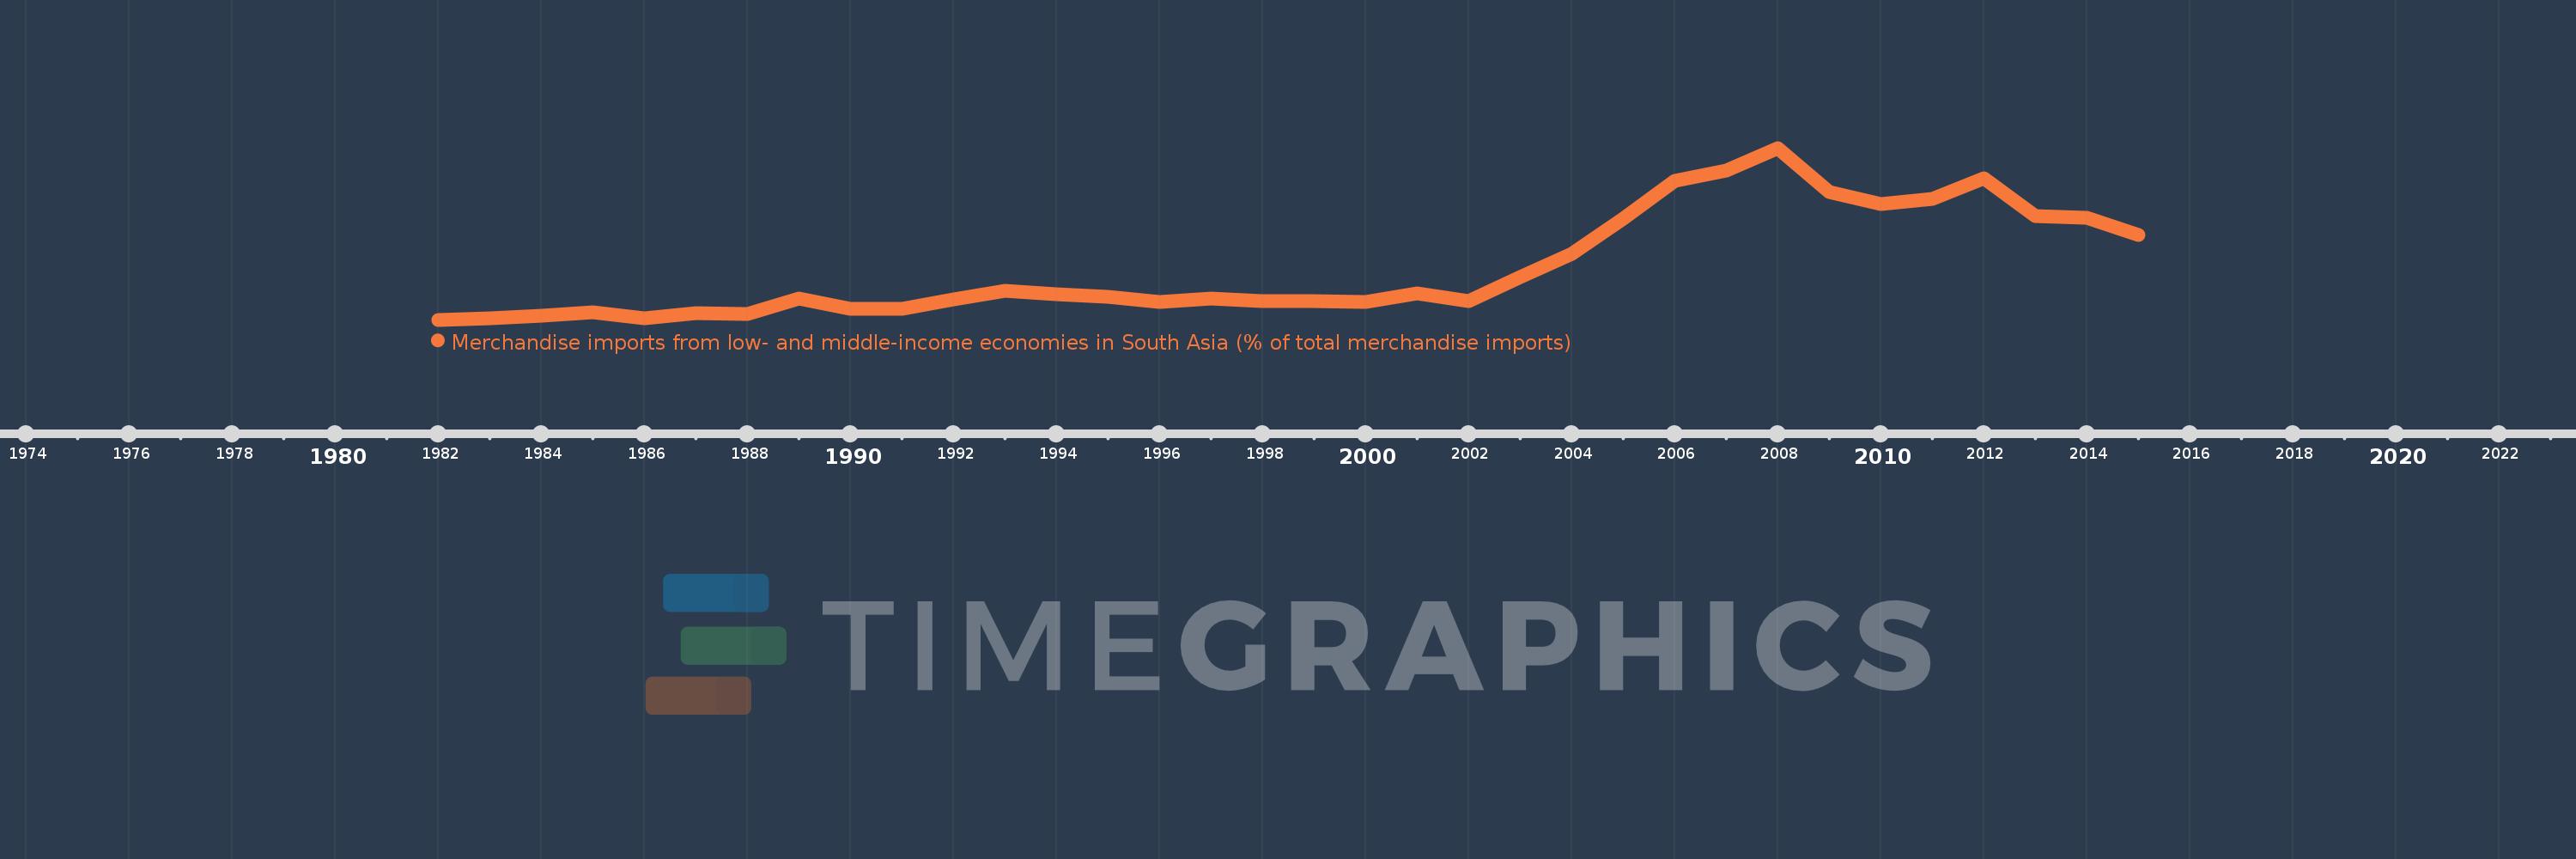
Merchandise imports from low- and middle-income economies in South Asia (% of total merchandise imports)
2015,2014,2013,2012,2011,2010,2009,2008,2007,2006,2005,2004,2003,2002,2001,2000,1999,1998,1997,1996,1995,1994,1993,1992,1991,1990,1989,1988,1987,1986,1985,1984,1983,1982
This statistics in other country:
AfghanistanAlbaniaAlgeriaAngolaAntigua and BarbudaArab WorldArgentinaArmeniaArubaAustraliaAustriaAzerbaijanBahamas, TheBahrainBangladeshBarbadosBelarusBelgiumBelizeBeninBermudaBoliviaBrazilBrunei DarussalamBulgariaBurkina FasoBurundiCabo VerdeCambodiaCameroonCanadaCaribbean small statesCentral African RepublicCentral Europe and the BalticsChadChileChinaColombiaCongo, Dem. Rep.Congo, Rep.Costa RicaCote d'IvoireCroatiaCubaCyprusCzech RepublicDenmarkDjiboutiDominicaDominican RepublicEarly-demographic dividendEast Asia & PacificEast Asia & Pacific (excluding high income)East Asia & Pacific (IDA & IBRD countries)EcuadorEgypt, Arab Rep.El SalvadorEstoniaEthiopiaEuro areaEurope & Central AsiaEurope & Central Asia (excluding high income)Europe & Central Asia (IDA & IBRD countries)European UnionFaroe IslandsFijiFinlandFragile and conflict affected situationsFranceGabonGambia, TheGeorgiaGermanyGhanaGibraltarGreeceGreenlandGrenadaGuatemalaGuineaGuyanaHaitiHeavily indebted poor countries (HIPC)High incomeHondurasHong Kong SAR, ChinaHungaryIBRD onlyIcelandIDA & IBRD totalIDA blendIDA onlyIDA totalIndiaIndonesiaIran, Islamic Rep.IraqIrelandIsraelItalyJamaicaJapanJordanKazakhstanKenyaKiribatiKorea, Dem. People’s Rep.Korea, Rep.KosovoKuwaitKyrgyz RepublicLao PDRLate-demographic dividendLatin America & Caribbean Latin America & Caribbean (excluding high income)Latin America & the Caribbean (IDA & IBRD countries)LatviaLeast developed countries: UN classificationLebanonLiberiaLibyaLithuaniaLow & middle incomeLow incomeLower middle incomeLuxembourgMacao SAR, ChinaMacedonia, FYRMadagascarMalawiMalaysiaMaldivesMaliMaltaMauritaniaMauritiusMexicoMiddle East & North AfricaMiddle East & North Africa (excluding high income)Middle East & North Africa (IDA & IBRD countries)Middle incomeMoldovaMongoliaMontenegroMoroccoMozambiqueMyanmarNauruNepalNetherlandsNew CaledoniaNew ZealandNicaraguaNigerNigeriaNorth AmericaNorwayOECD membersOmanOther small statesPacific island small statesPakistanPanamaPapua New GuineaParaguayPeruPhilippinesPolandPortugalPost-demographic dividendPre-demographic dividendQatarRomaniaRussian FederationRwandaSamoaSaudi ArabiaSenegalSerbiaSeychellesSierra LeoneSingaporeSlovak RepublicSloveniaSmall statesSolomon IslandsSomaliaSouth AfricaSouth AsiaSouth Asia (IDA & IBRD)SpainSri LankaSt. Kitts and NevisSt. LuciaSt. Vincent and the GrenadinesSub-Saharan Africa Sub-Saharan Africa (excluding high income)Sub-Saharan Africa (IDA & IBRD countries)SudanSurinameSwedenSwitzerlandSyrian Arab RepublicTajikistanTanzaniaThailandTogoTongaTrinidad and TobagoTunisiaTurkeyTurkmenistanUgandaUkraineUnited Arab EmiratesUnited KingdomUnited StatesUpper middle incomeUruguayUzbekistanVanuatuVenezuela, RBVietnamWorldYemen, Rep.ZambiaZimbabwe Timeline:
This timeline shows a graph from 1982 to 2015 of Djibouti. No data until 1981. Number of actual observations by date: 34.
Source name:
World Development Indicators
Source organization:
World Bank staff estimates based data from International Monetary Fund's Direction of Trade database.
Categories, topics:
Private Sector, Trade
Last updated:
apr 23, 2017
Indicators value changes by year
Maximum:
23.491
jan 1, 2008
At the date of observation
Value
Absolute change
Change from previous value
jan 1, 1982
0.236
+0.236
0.0%
jan 1, 1983
0.416
+0.18
76.57%
jan 1, 1984
0.759
+0.343
82.52%
jan 1, 1985
1.289
+0.53
69.76%
jan 1, 1986
0.453
-0.836
-64.89%
jan 1, 1987
1.123
+0.671
148.2%
jan 1, 1988
1.069
-0.054
-4.84%
jan 1, 1989
3.07
+2.001
187.17%
jan 1, 1990
1.675
-1.394
-45.42%
jan 1, 1991
1.671
-0.004
-0.26%
jan 1, 1992
3.006
+1.335
79.88%
jan 1, 1993
4.203
+1.197
39.83%
jan 1, 1994
3.73
-0.473
-11.25%
jan 1, 1995
3.368
-0.362
-9.71%
jan 1, 1996
2.601
-0.766
-22.76%
jan 1, 1997
3.068
+0.466
17.92%
jan 1, 1998
2.736
-0.331
-10.79%
jan 1, 1999
2.785
+0.049
1.79%
jan 1, 2000
2.626
-0.159
-5.72%
jan 1, 2001
3.794
+1.168
44.47%
jan 1, 2002
2.787
-1.007
-26.53%
jan 1, 2003
5.995
+3.207
115.06%
jan 1, 2004
9.201
+3.206
53.49%
jan 1, 2005
13.959
+4.758
51.71%
jan 1, 2006
19.081
+5.122
36.69%
jan 1, 2007
20.473
+1.392
7.3%
jan 1, 2008
23.491
+3.018
14.74%
jan 1, 2009
17.576
-5.915
-25.18%
jan 1, 2010
15.935
-1.641
-9.34%
jan 1, 2011
16.596
+0.661
4.15%
jan 1, 2012
19.431
+2.834
17.08%
jan 1, 2013
14.23
-5.201
-26.77%
jan 1, 2014
14.008
-0.221
-1.55%
jan 1, 2015
11.726
-2.282
-16.29%
Ranking of countries by current statistics by years


Comments: